| AODV Image of the Handler: 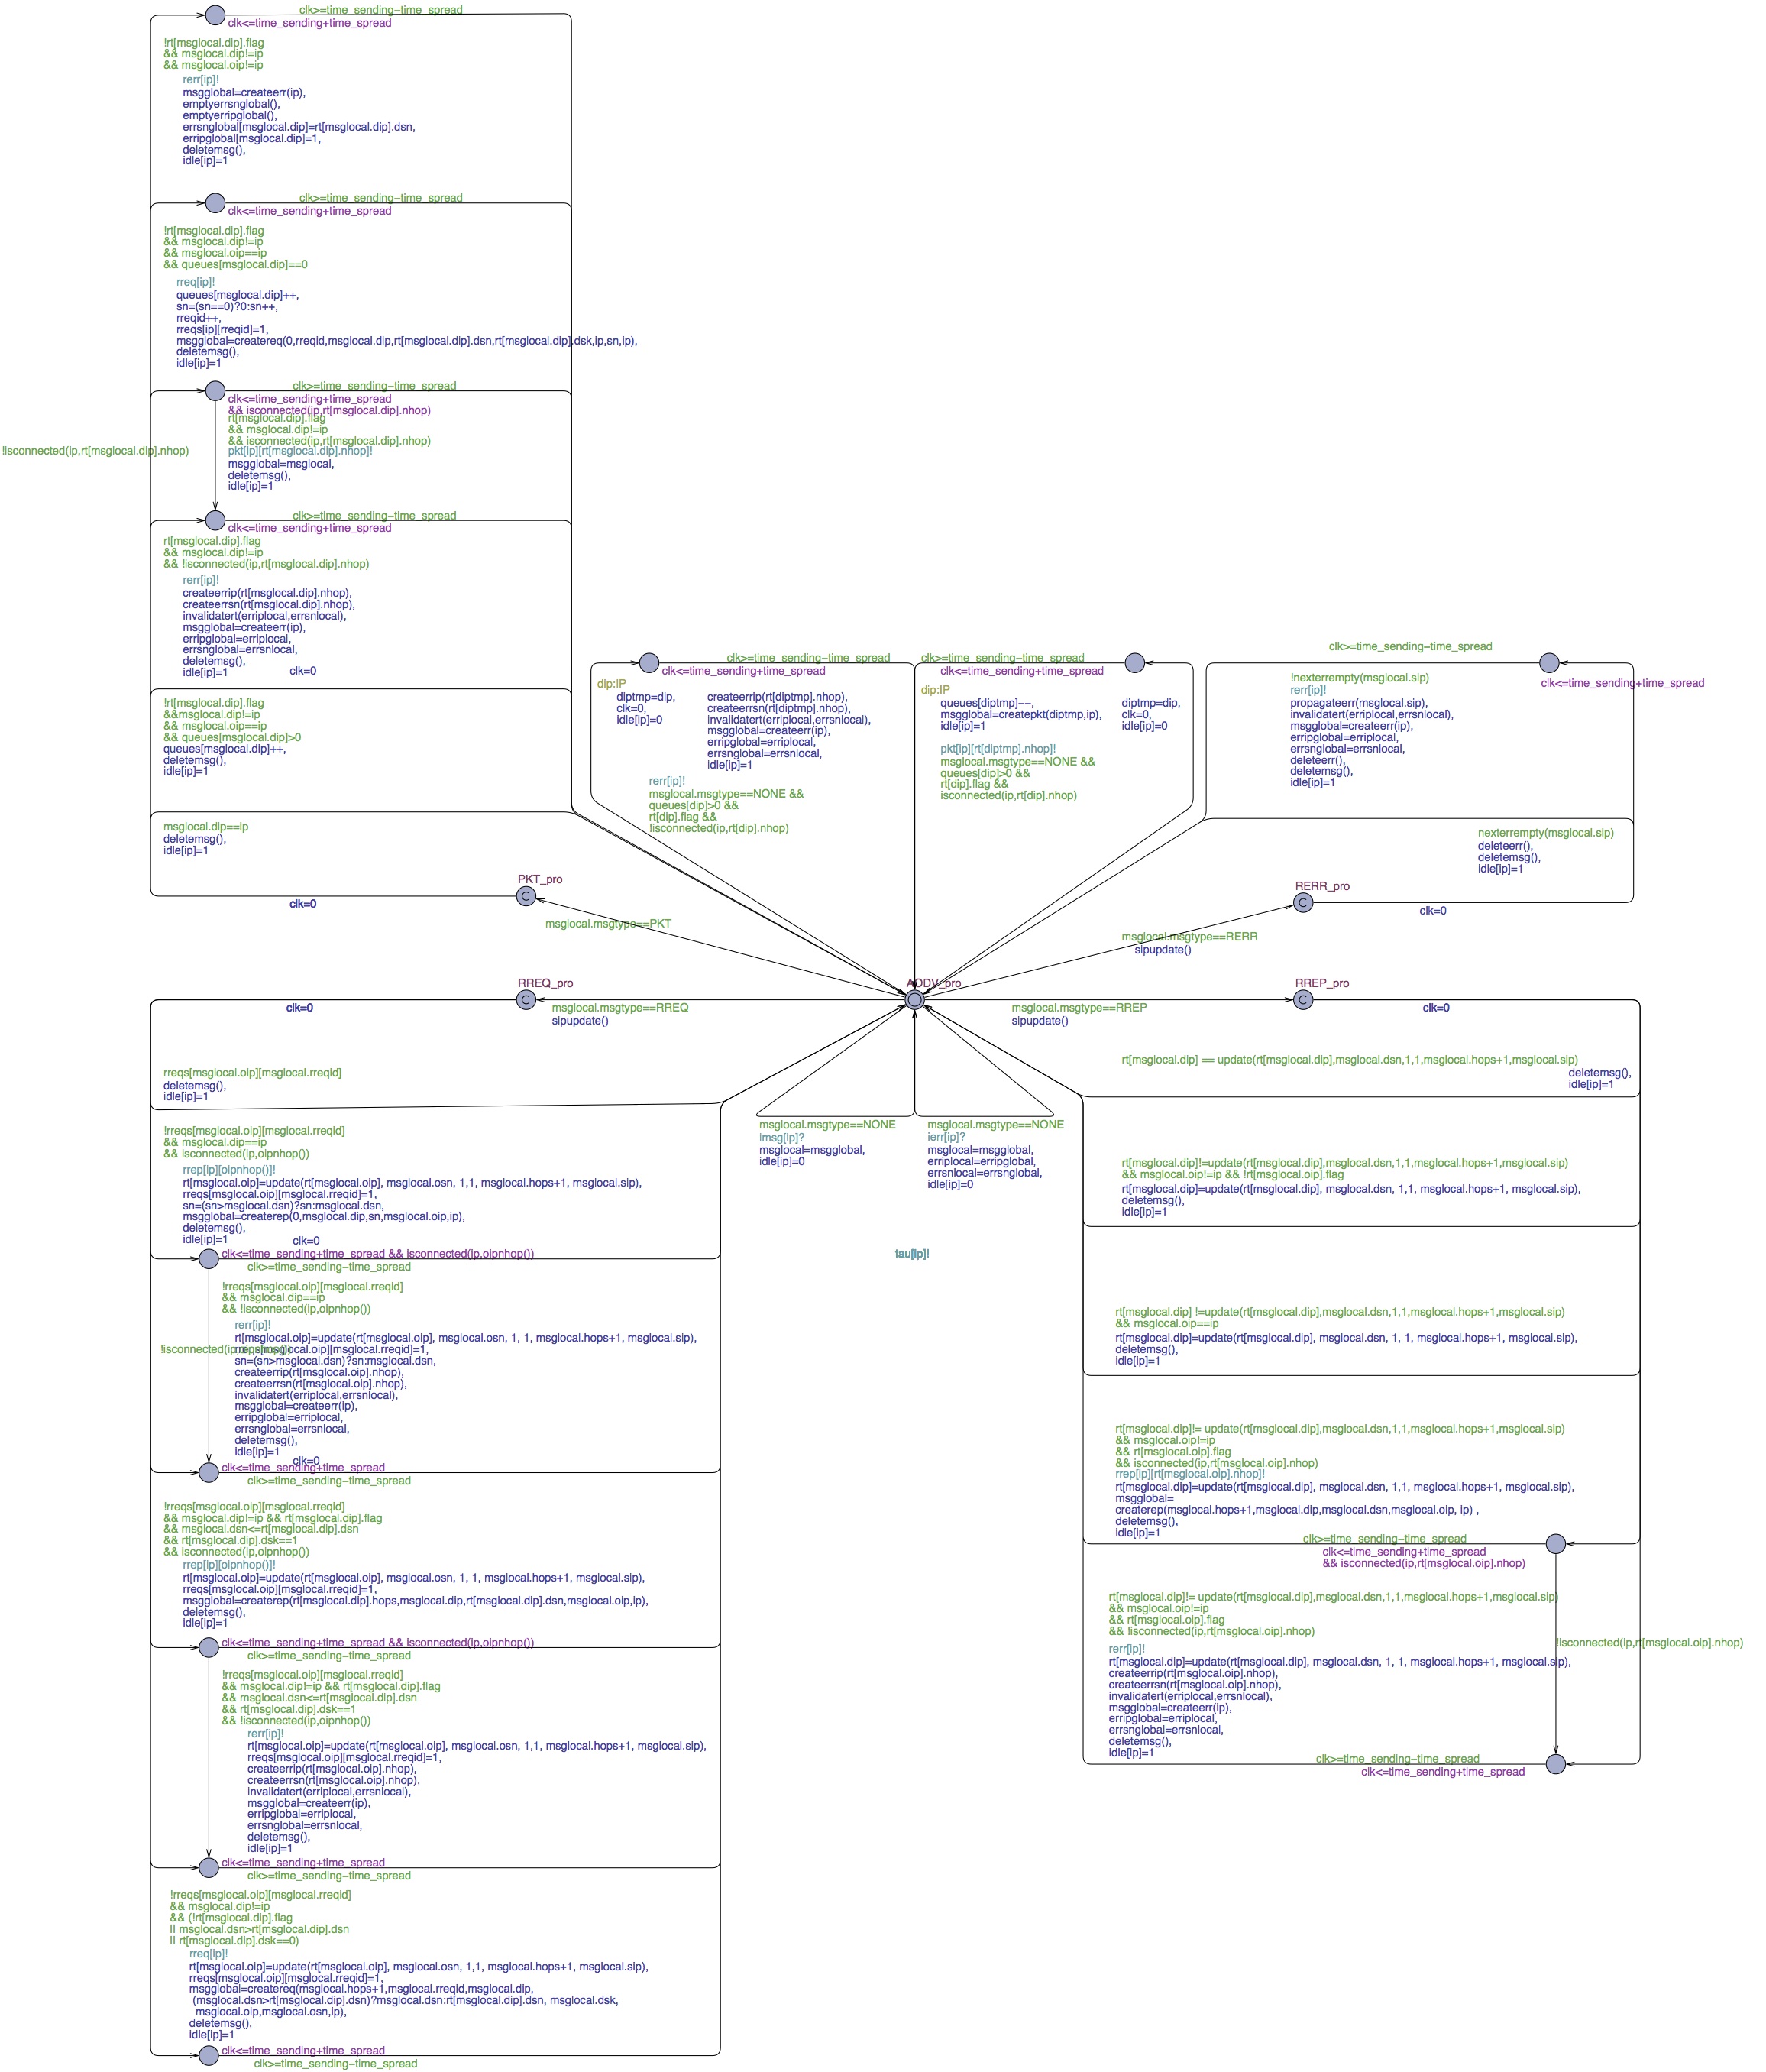 | DYMO Image of the Handler: 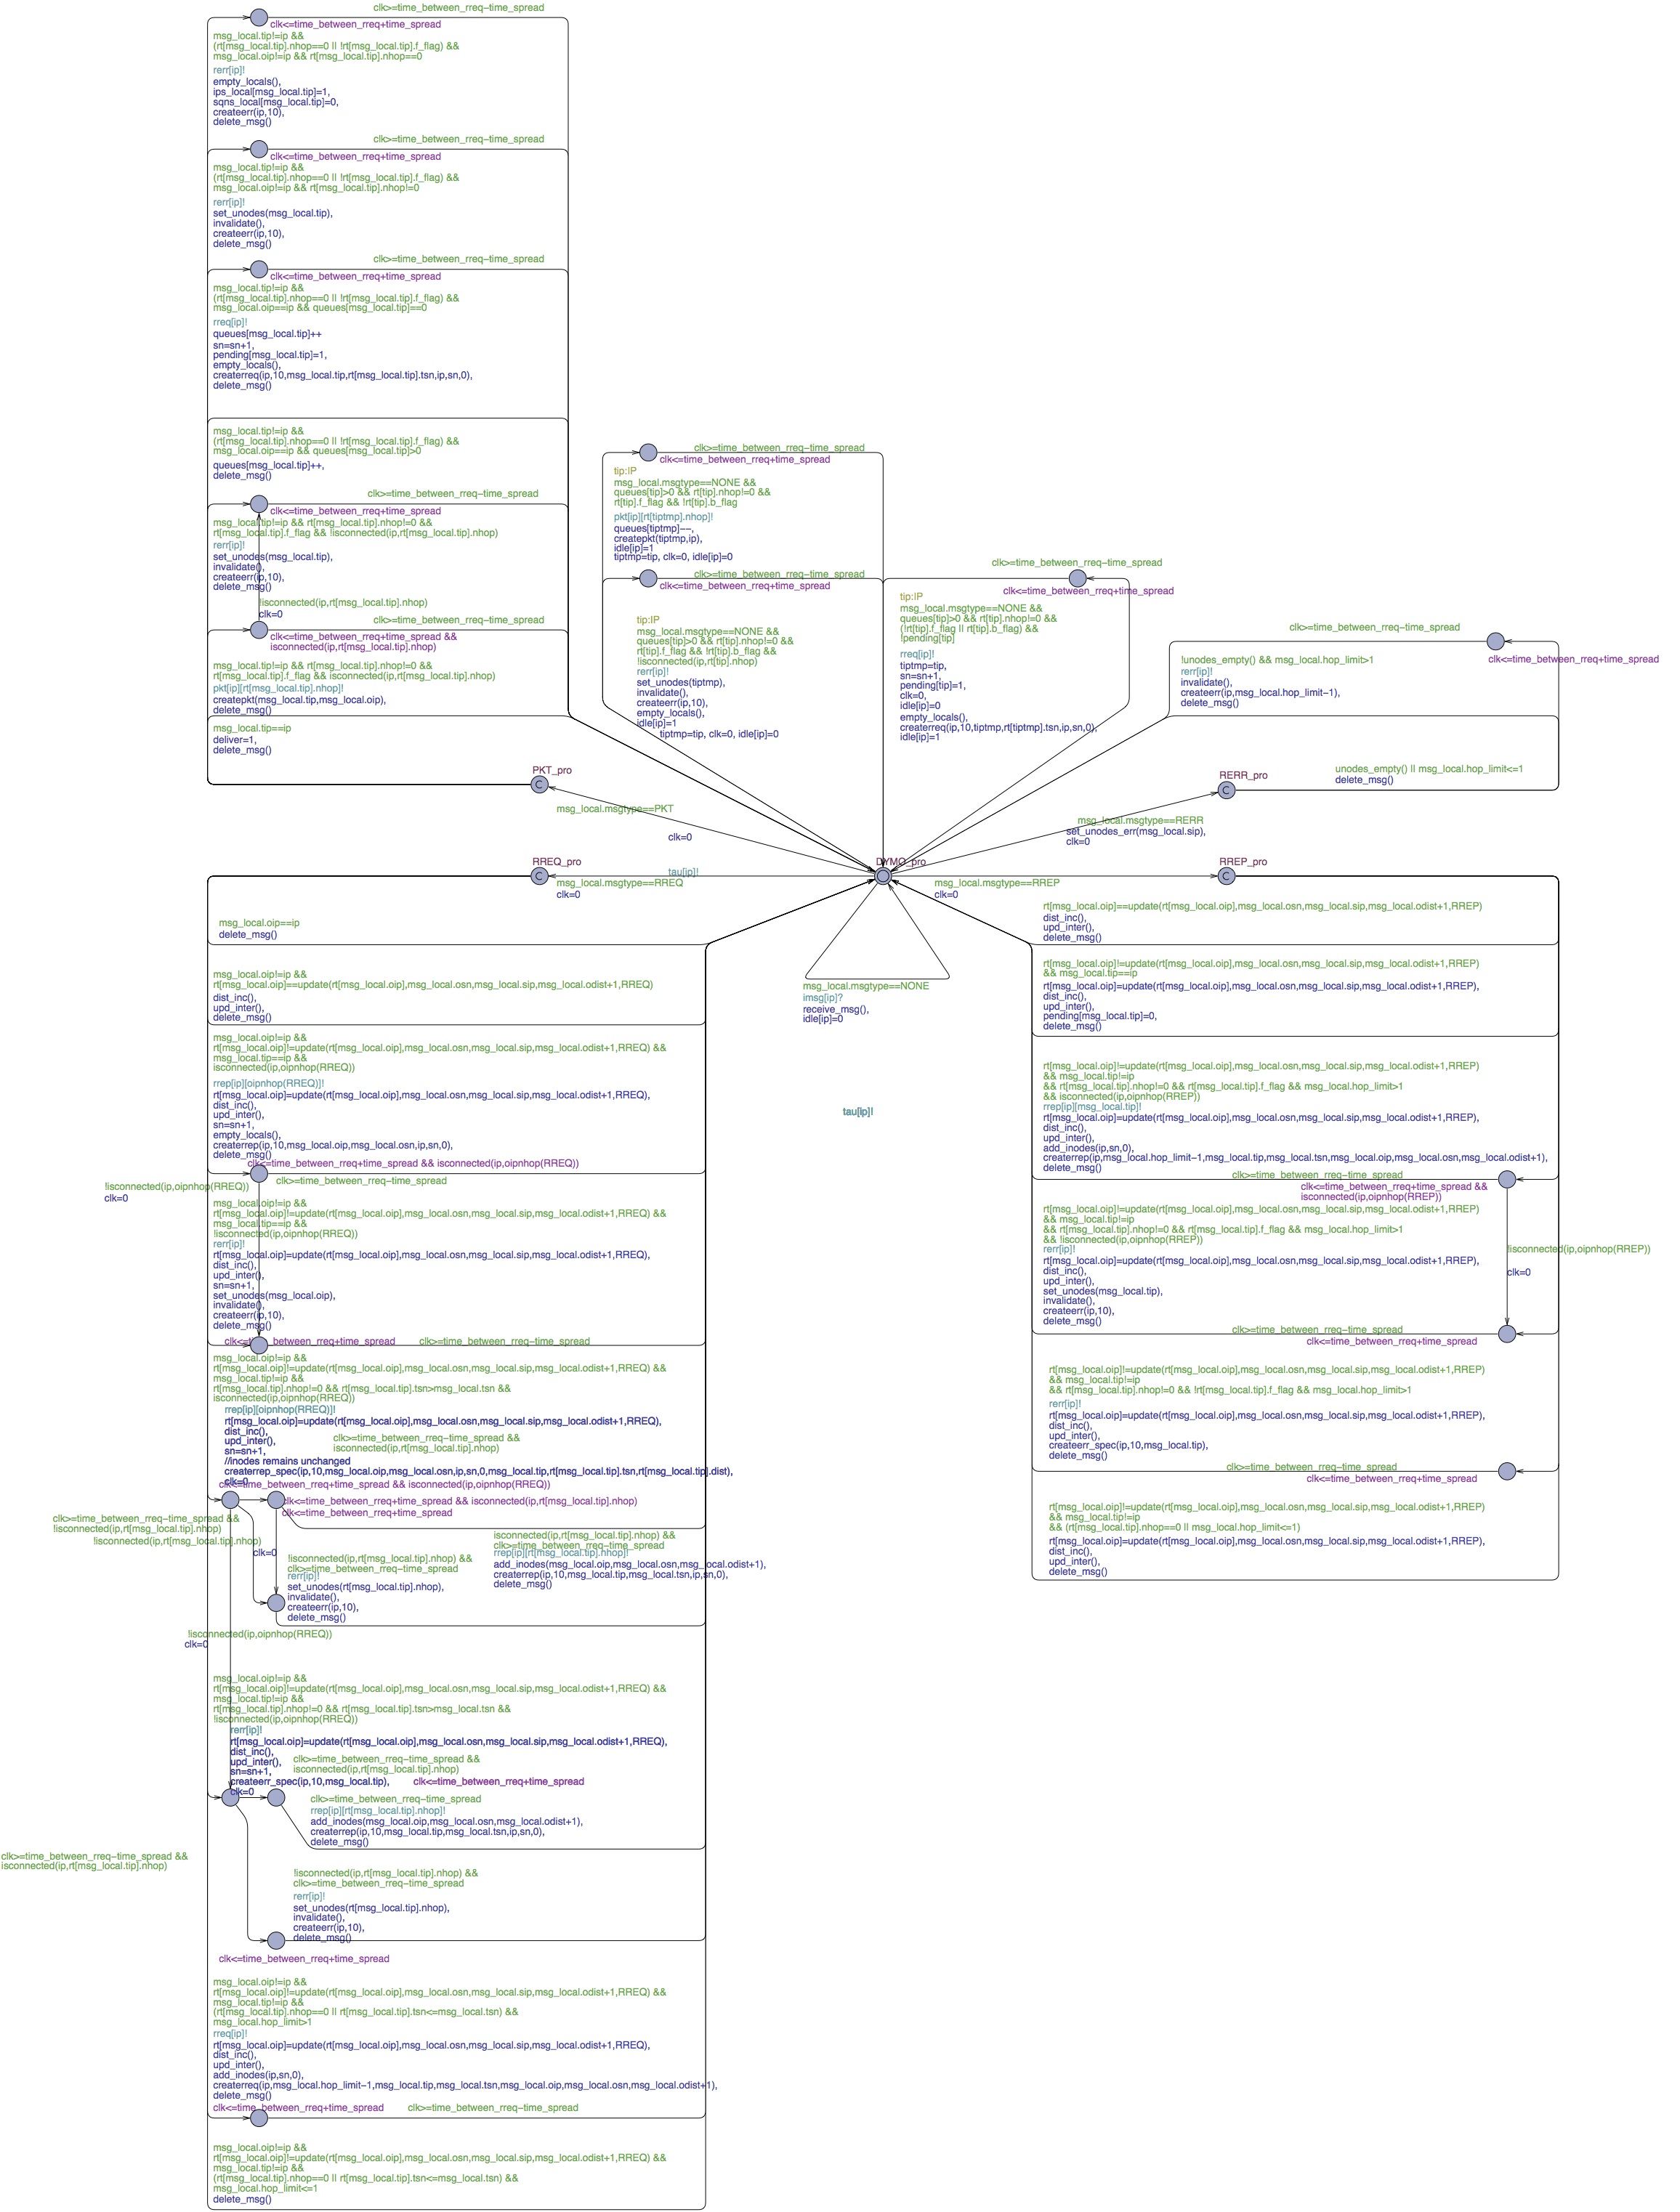 |
Abstract: Several case studies indicate that model checking is limited in the analysis of mesh networks: state space explosion restricts applicability to at most 10 node networks, and quantitative reasoning, often sufficient for network evaluation, is not possible. Both deficiencies can be overcome to some extent by the use of statistical model checkers, such as SMC-Uppaal. In this paper we illustrate this by a quantitative analysis of two well-known routing protocols for wireless mesh networks, namely AODV and DYMO. Moreover, we push the limits and show that this technology is capable of analysing networks of up to 100 nodes.
Paper: pdf
Our models for AODV and DYMO follow the same basic architecture in the network protocol layer. Each node maintains a message queue to store incoming messages and a processor for handling messages. Whilst the message queue is always enabled to receive messages, message handling can take time and so communication between queue and handler occurs only when the handler has successfully processed a message. The workflow of the handler is as follows: first, the next (oldest) message is loaded from its message queue. Depending on the type of message the routing table is updated and, if necessary, a new message is created, and either broadcast or unicast.
| AODV Image of the Handler: | DYMO Image of the Handler: |
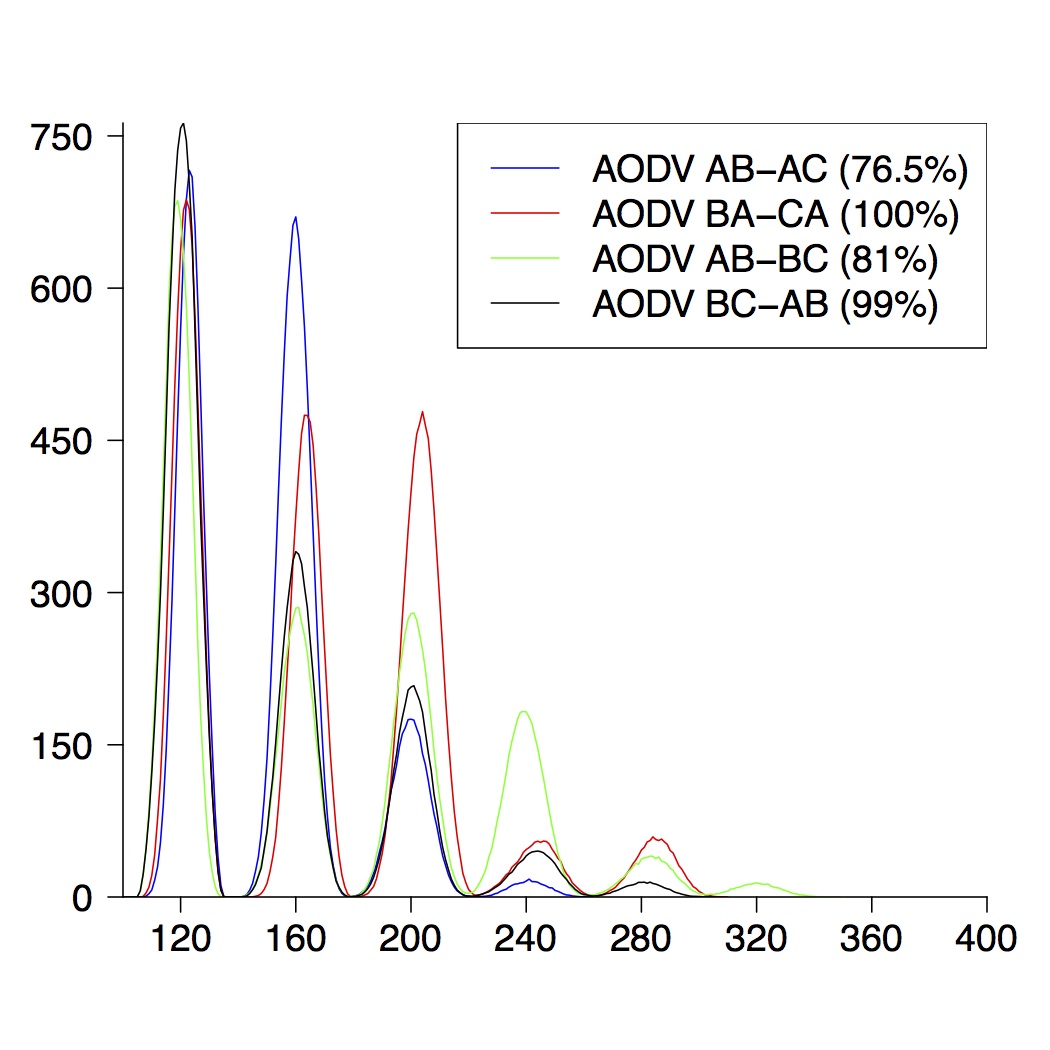
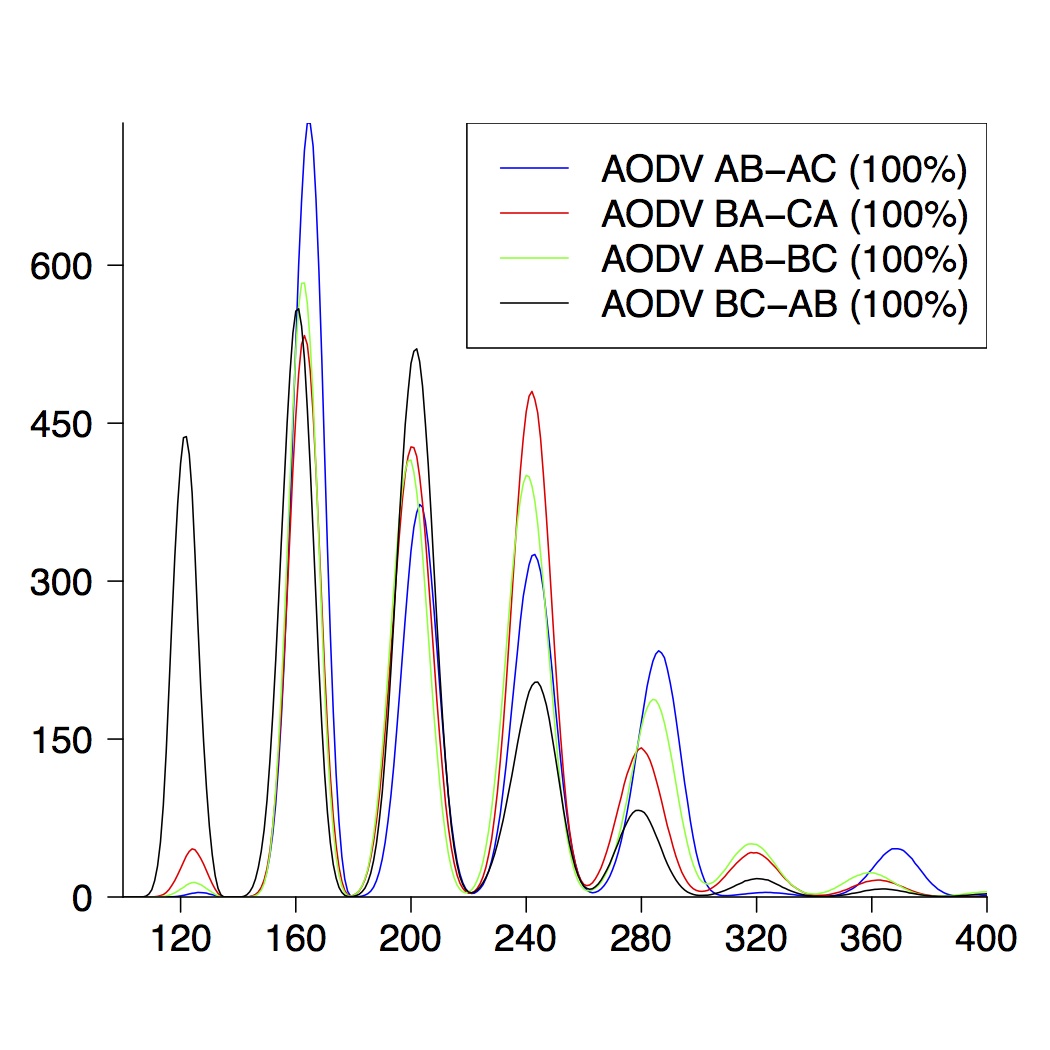
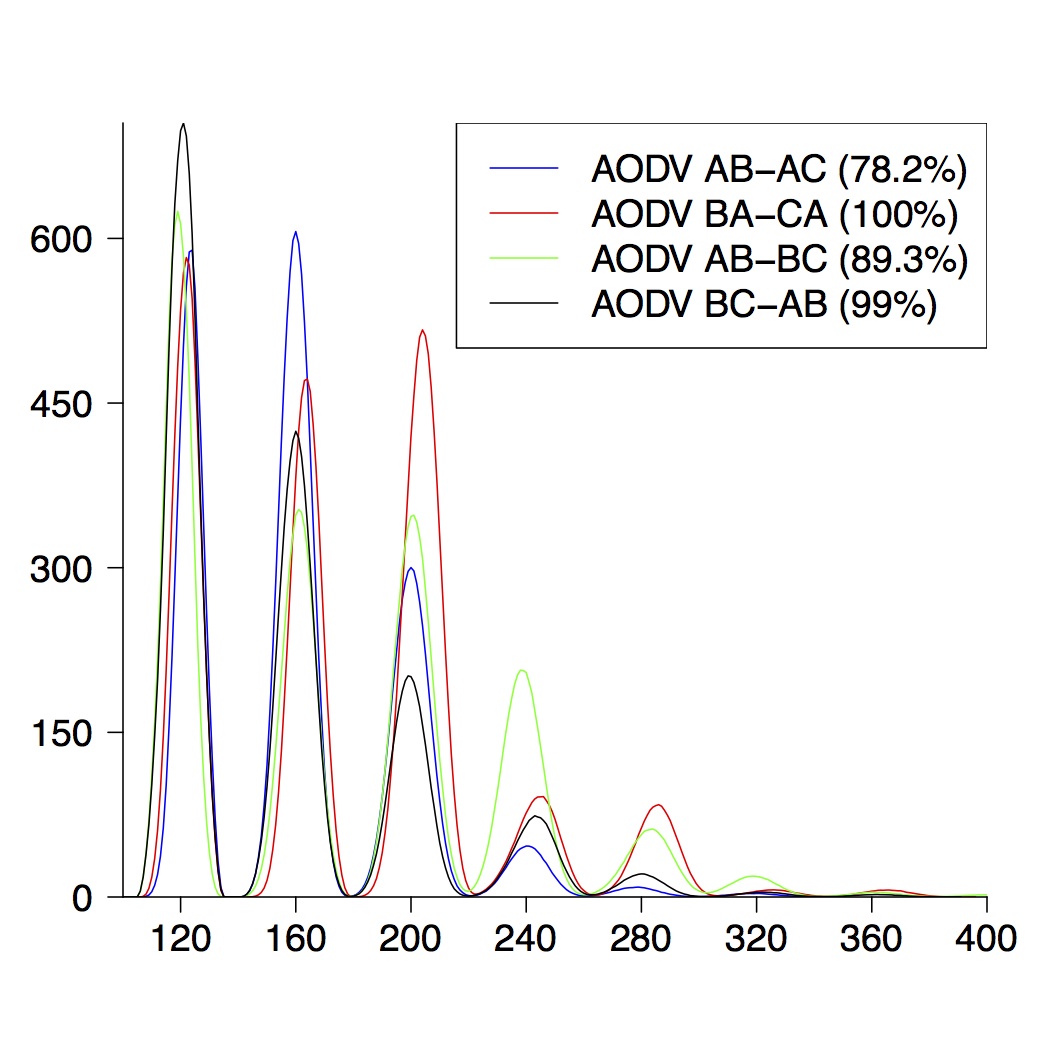
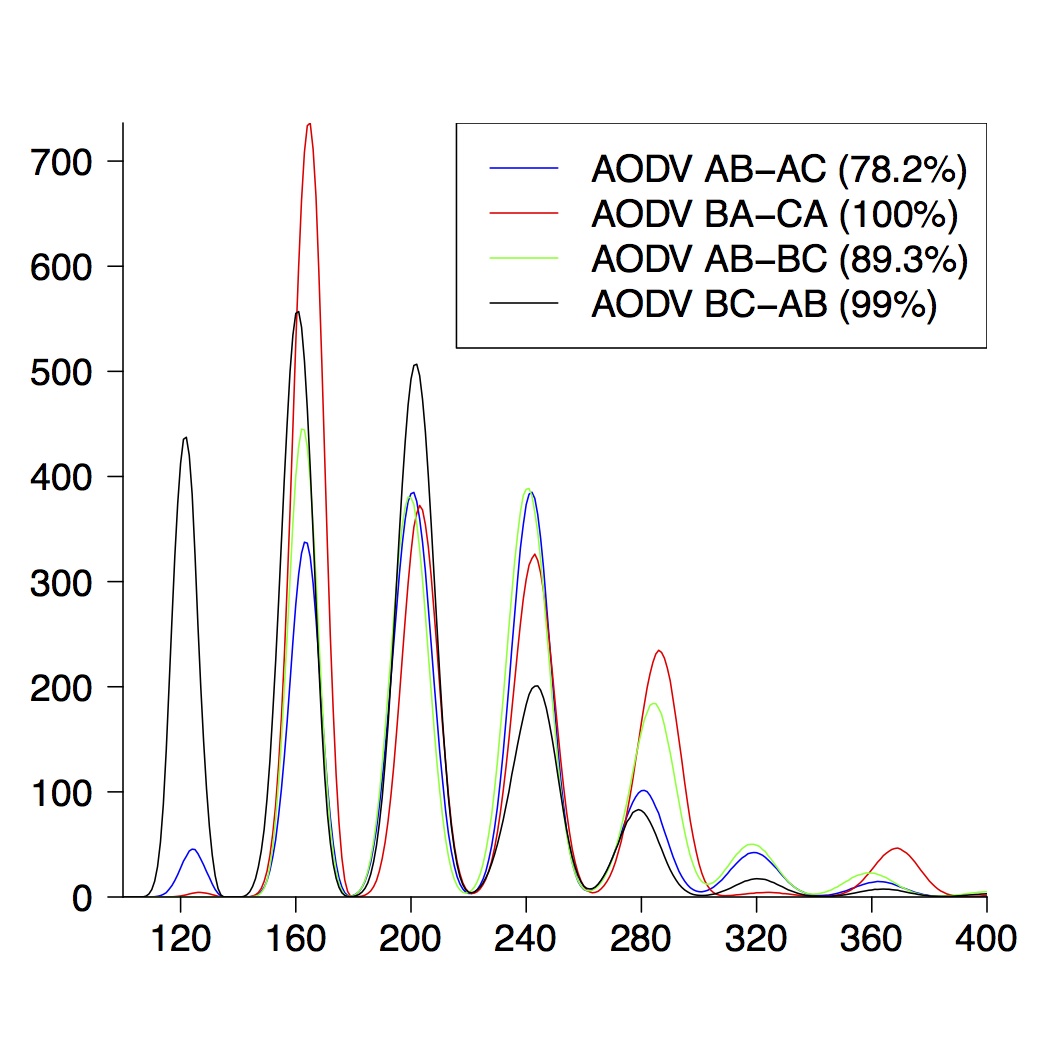
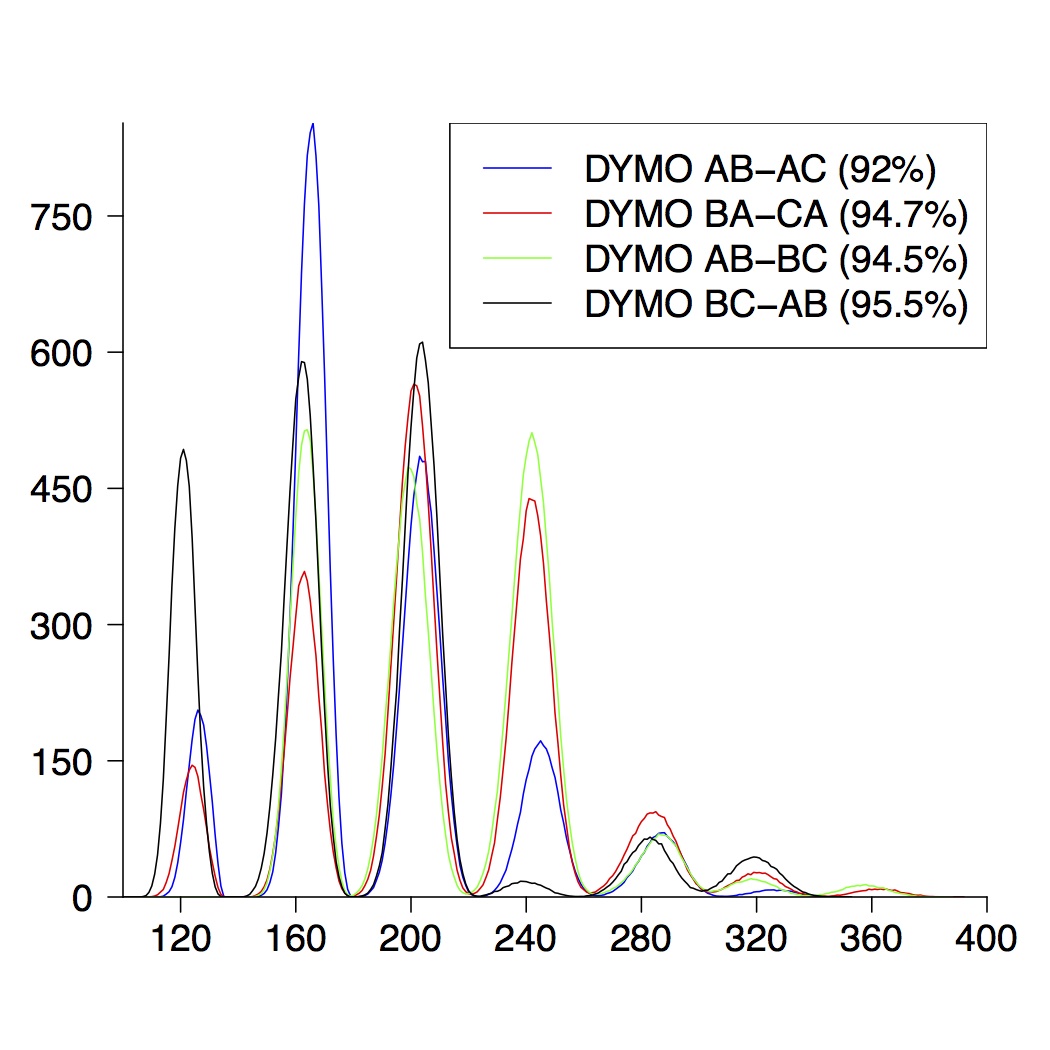
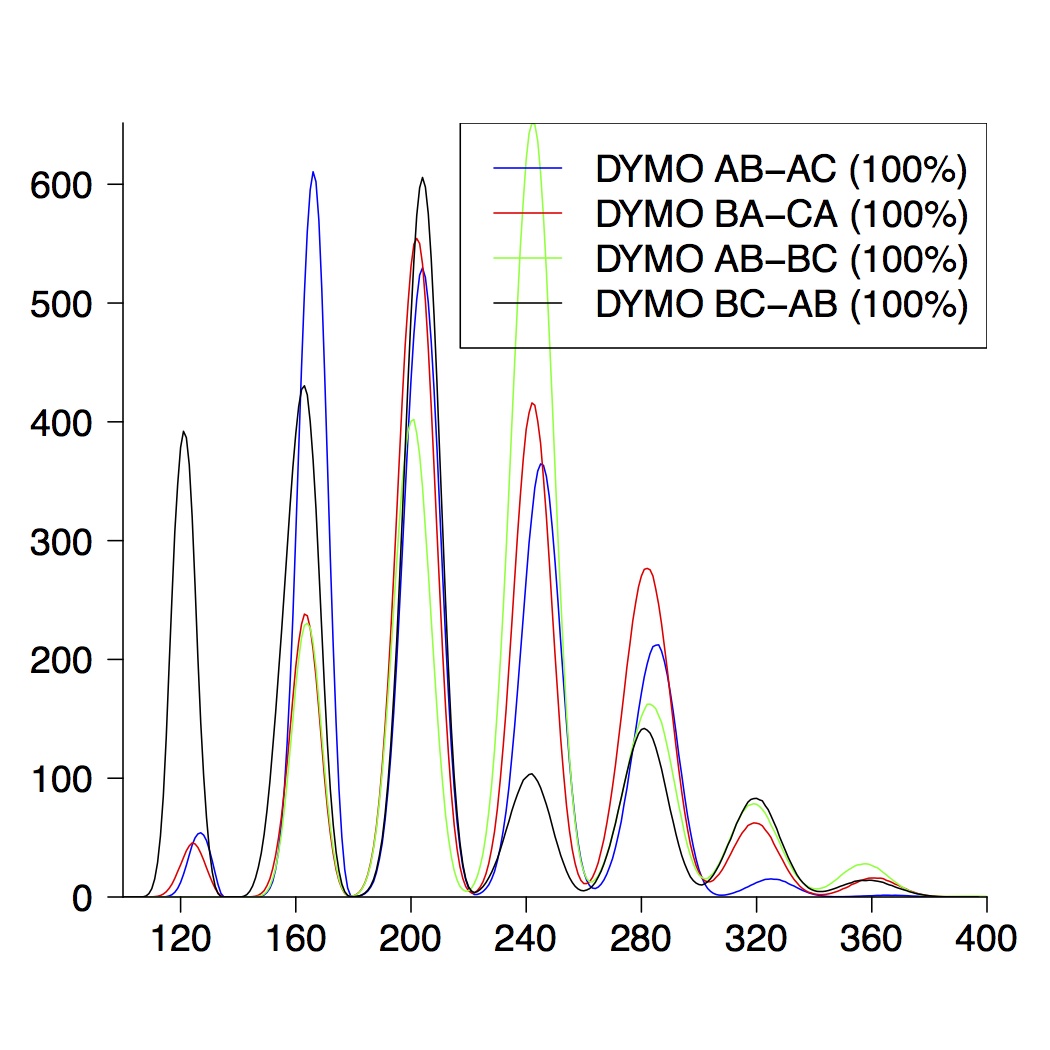
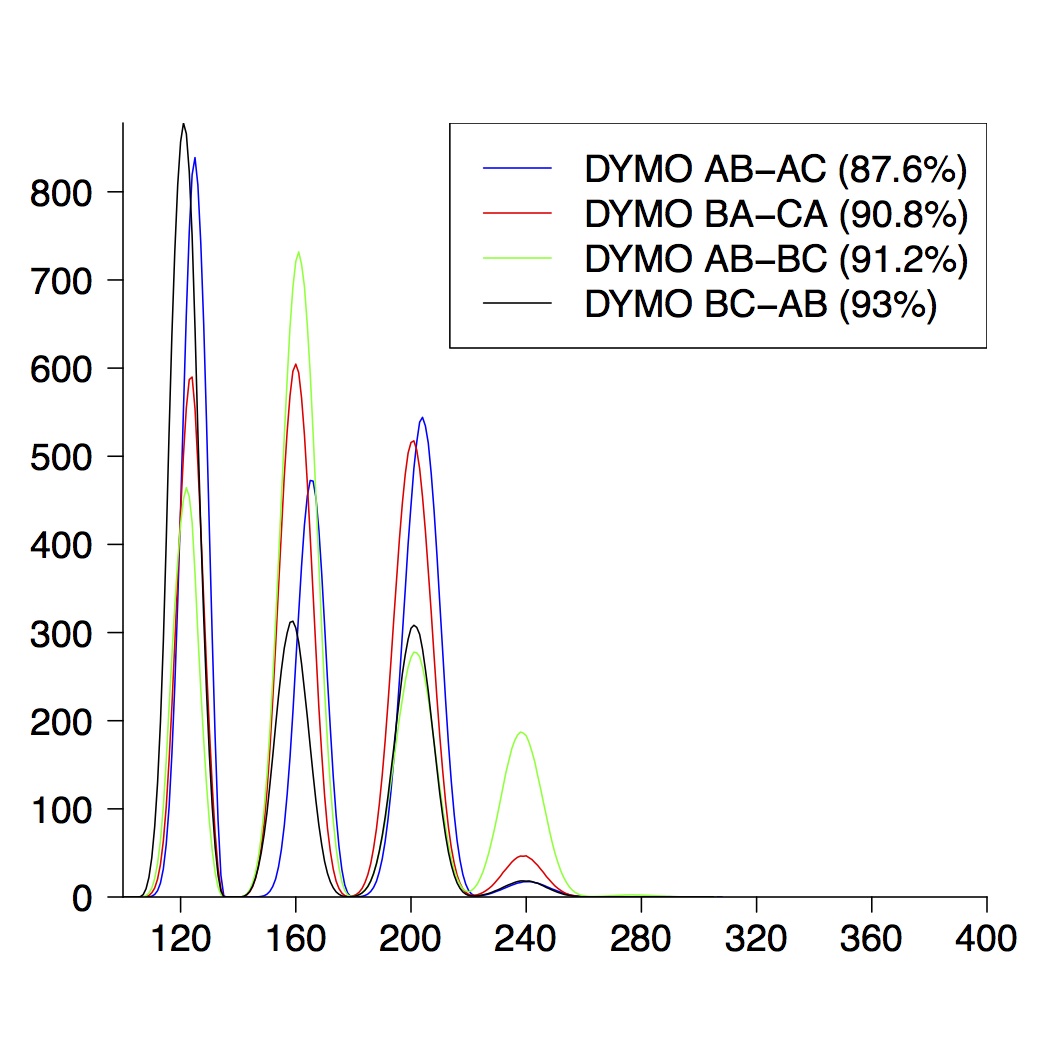
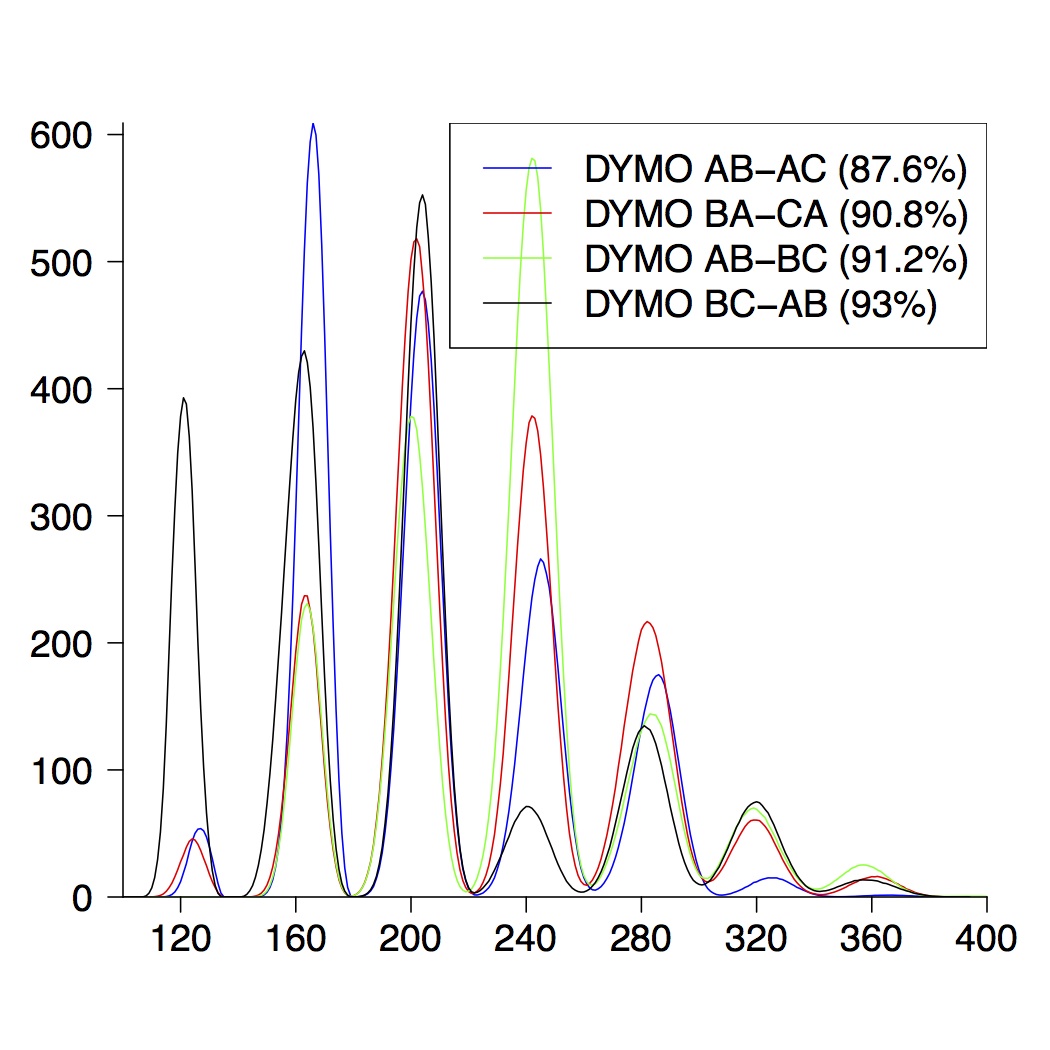
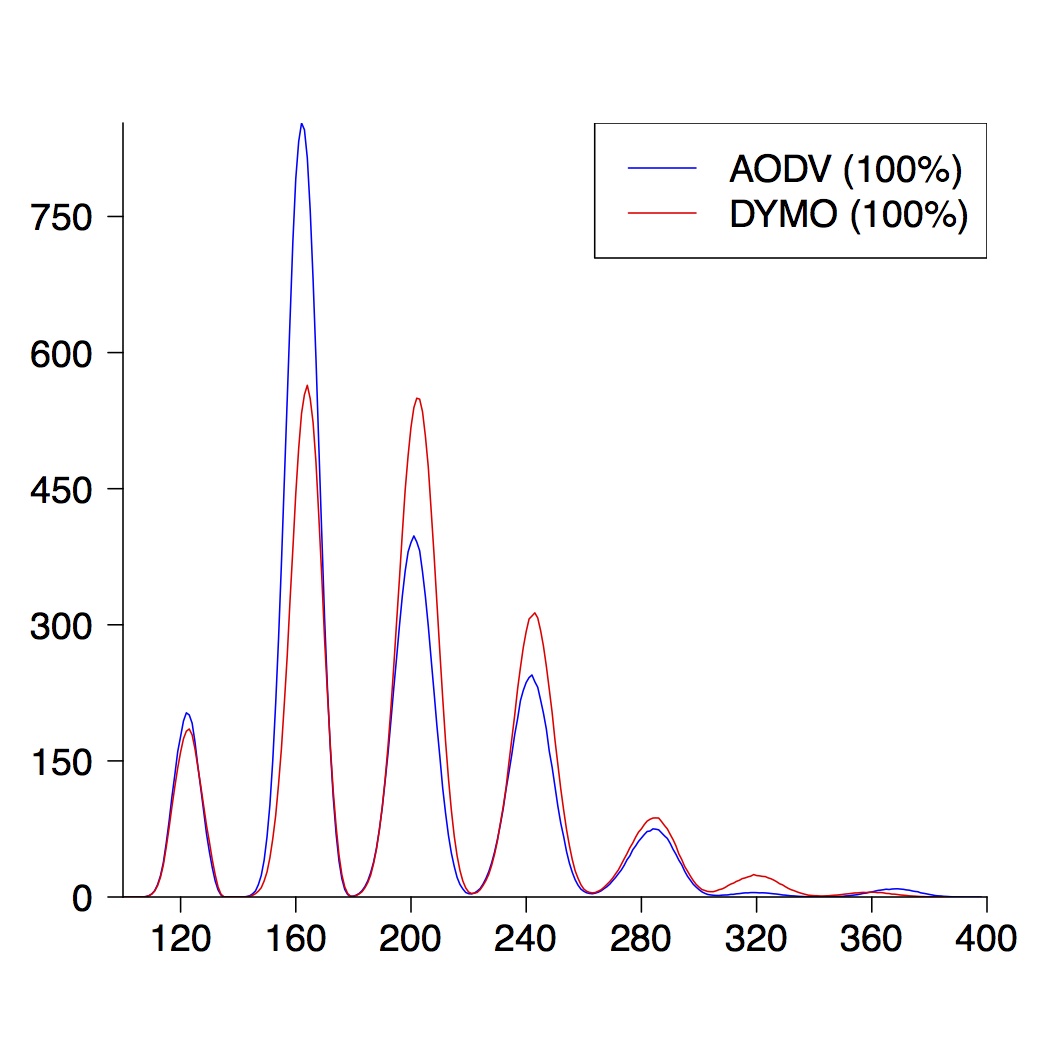
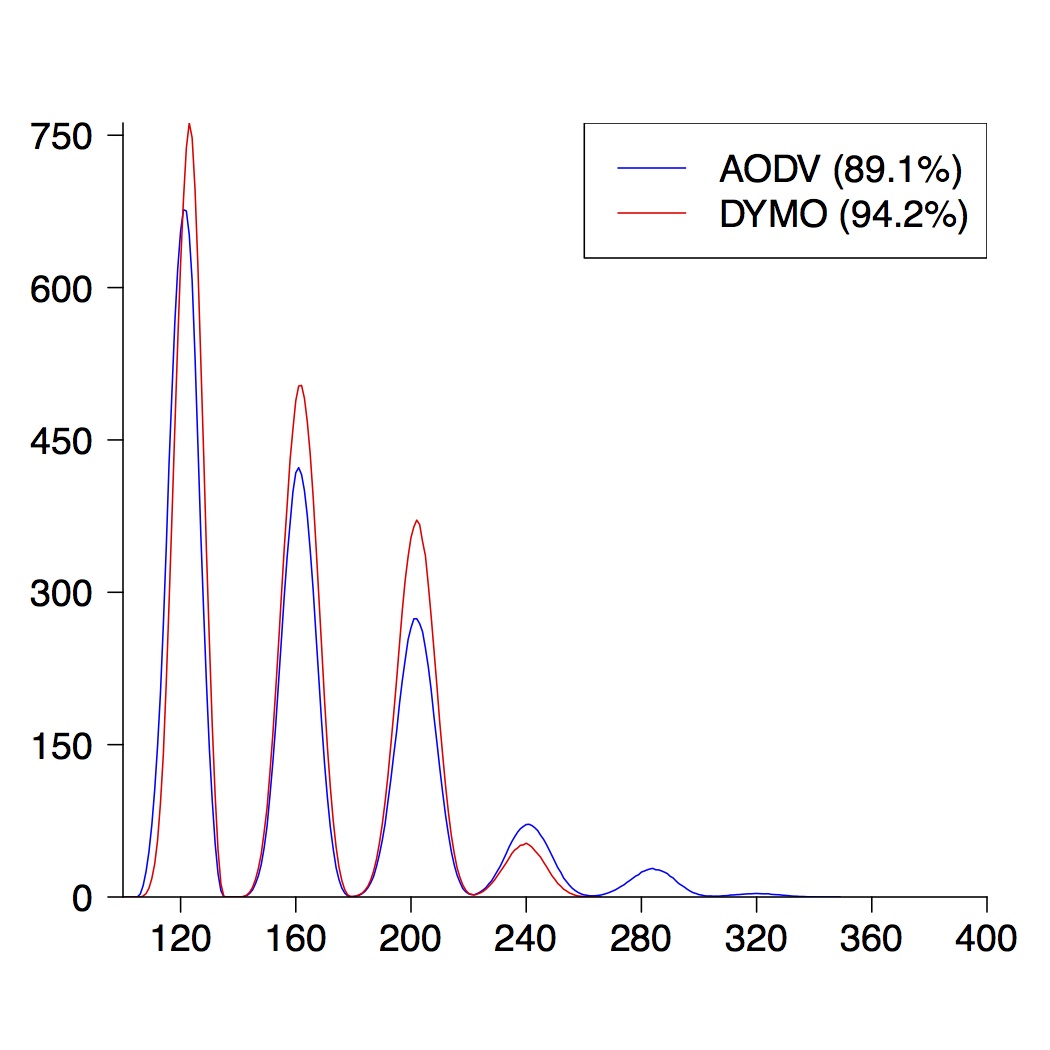
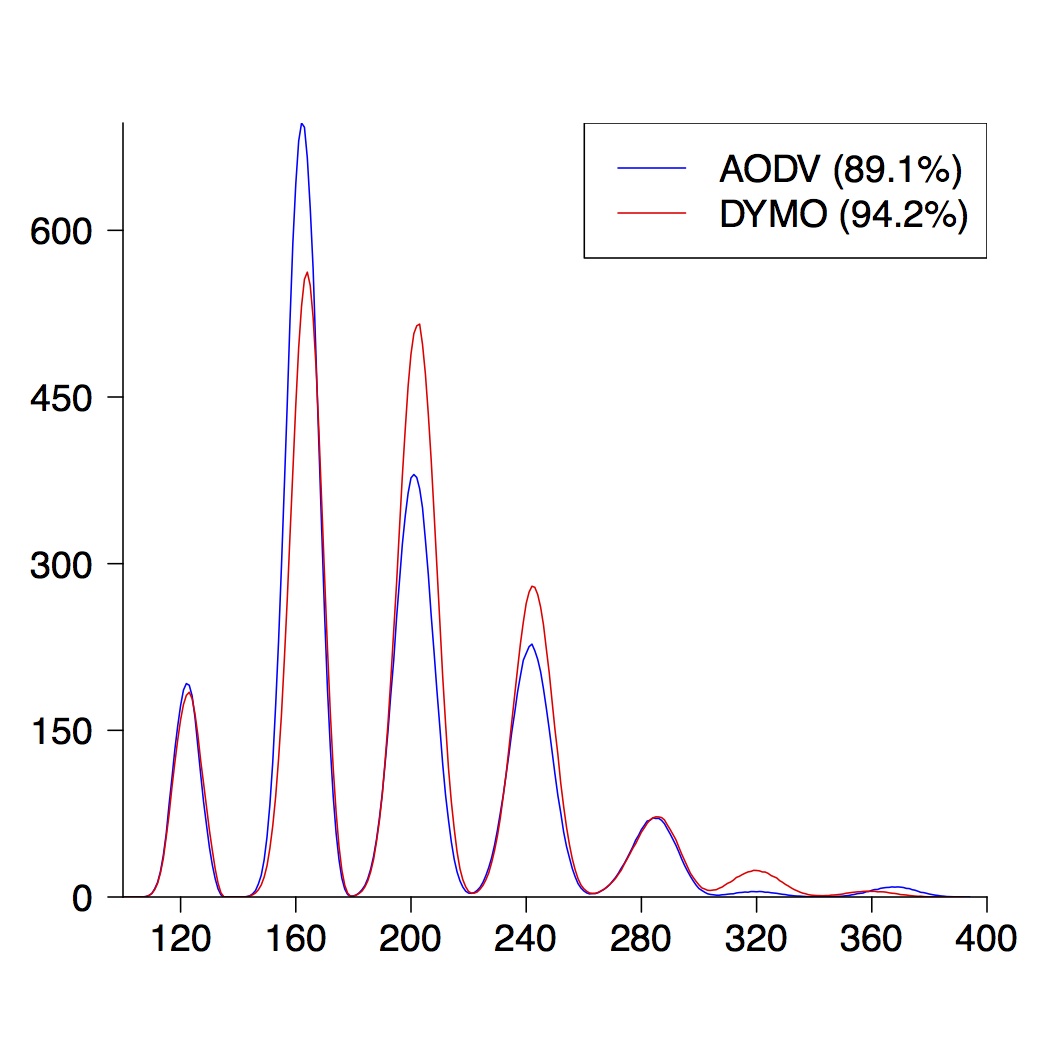
We performed the same experiments for DYMO. Here we present the graphical results for network topologies of size 3, 4 and 5.
| 3-Node Topologies | ||
|---|---|---|
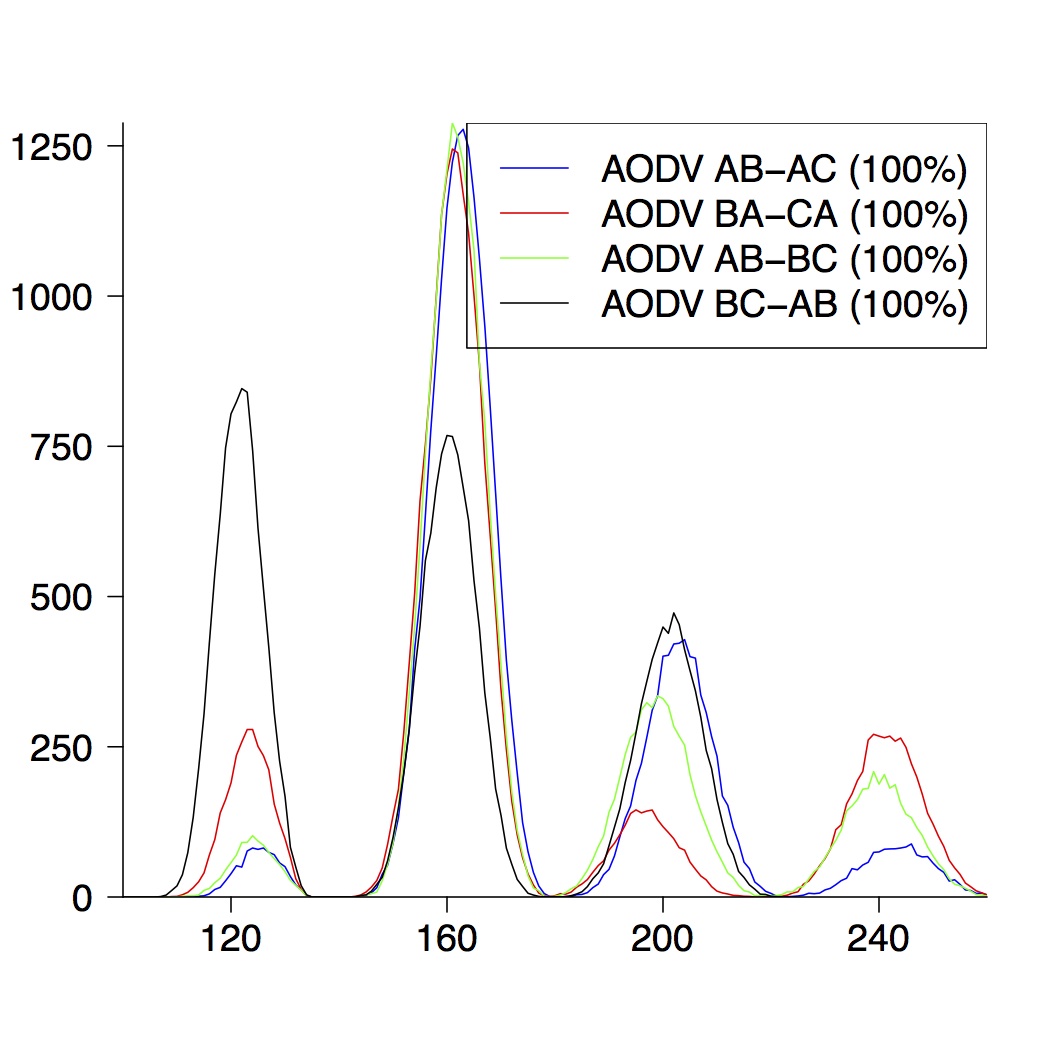 | 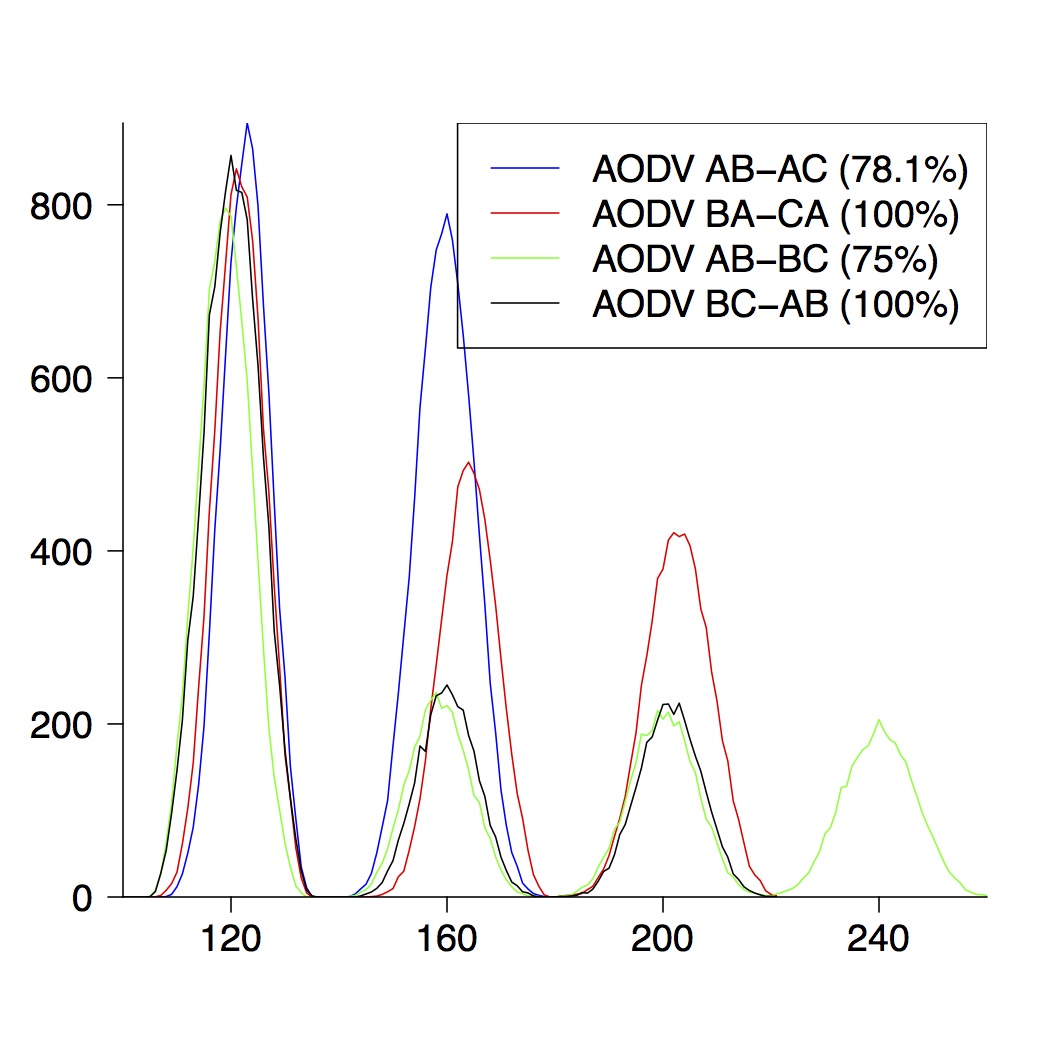 | 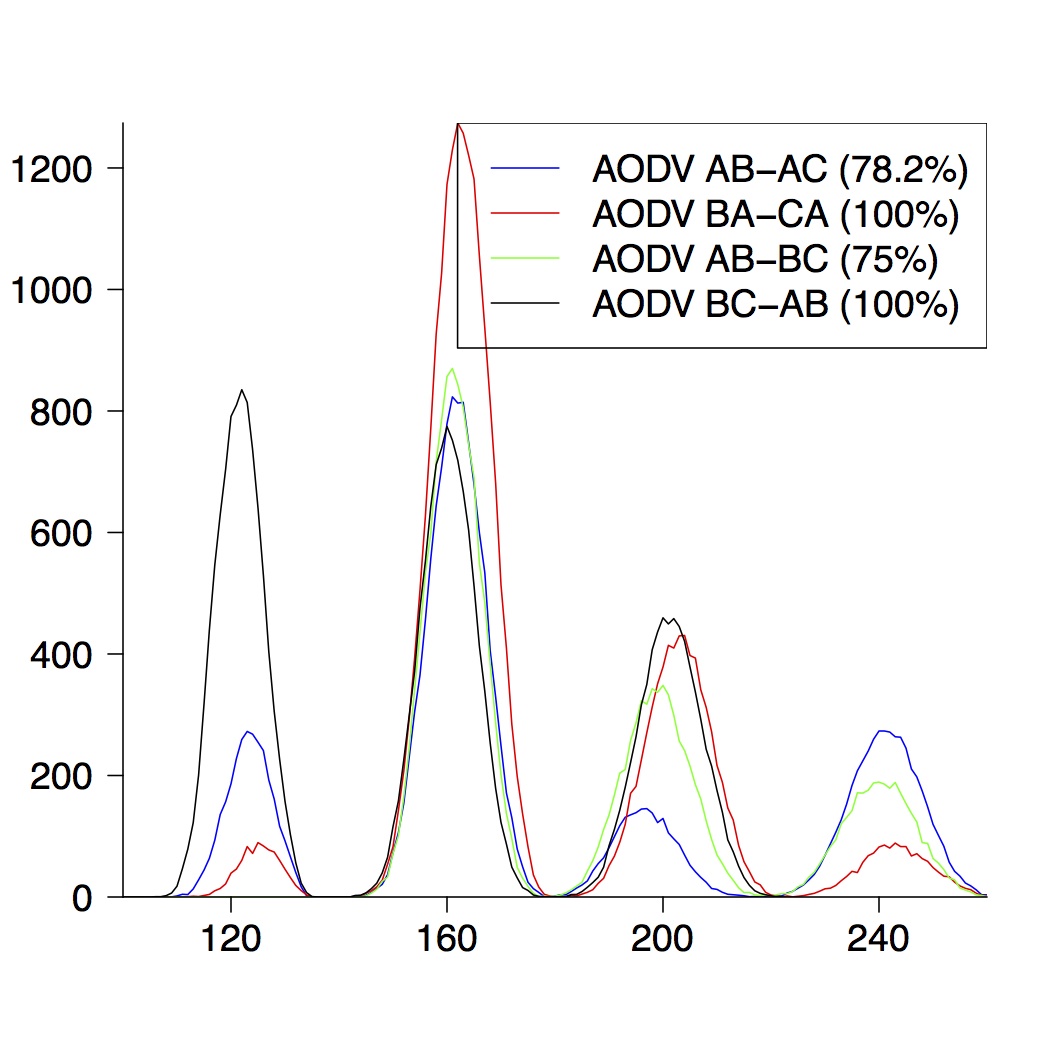 |
| (a) running time of AODV | (b) route establishment | (c) combined properties |
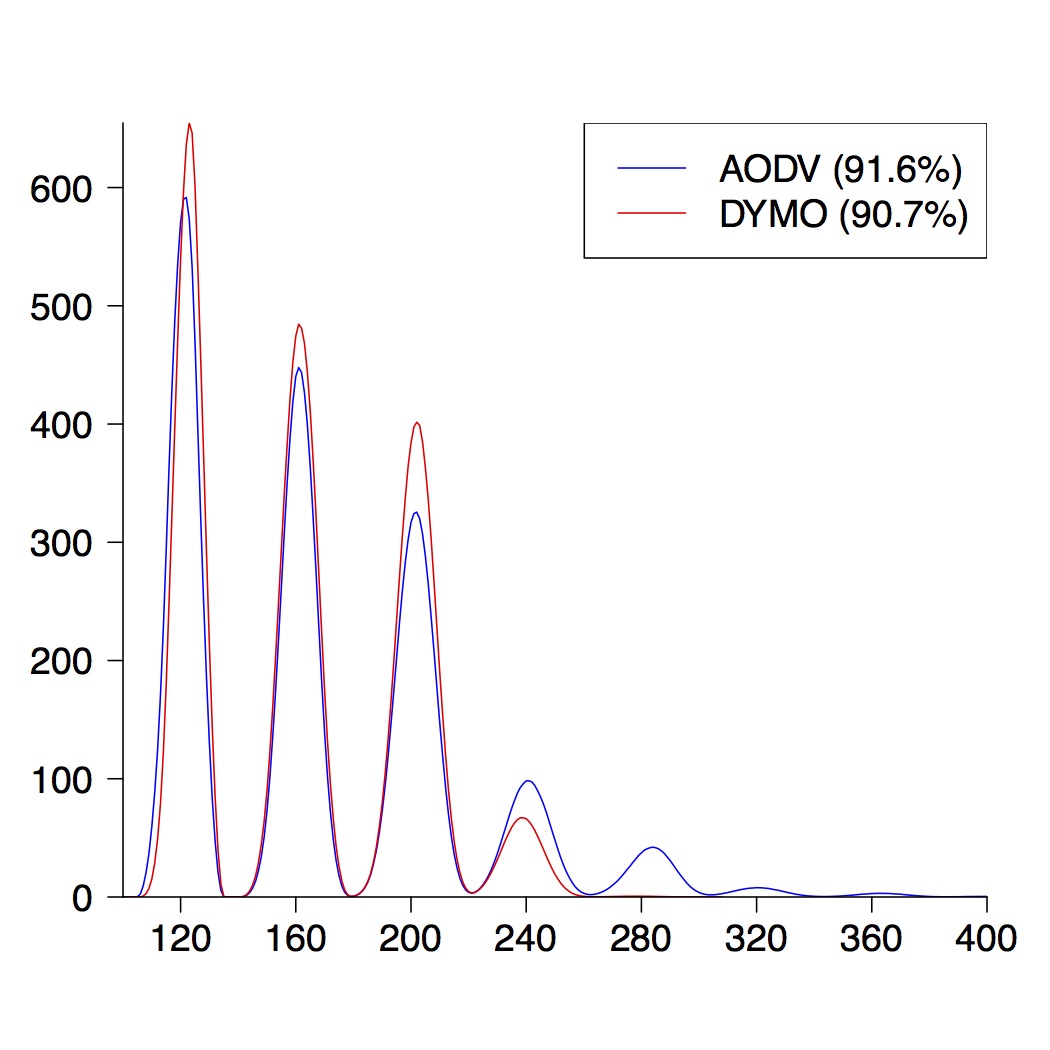
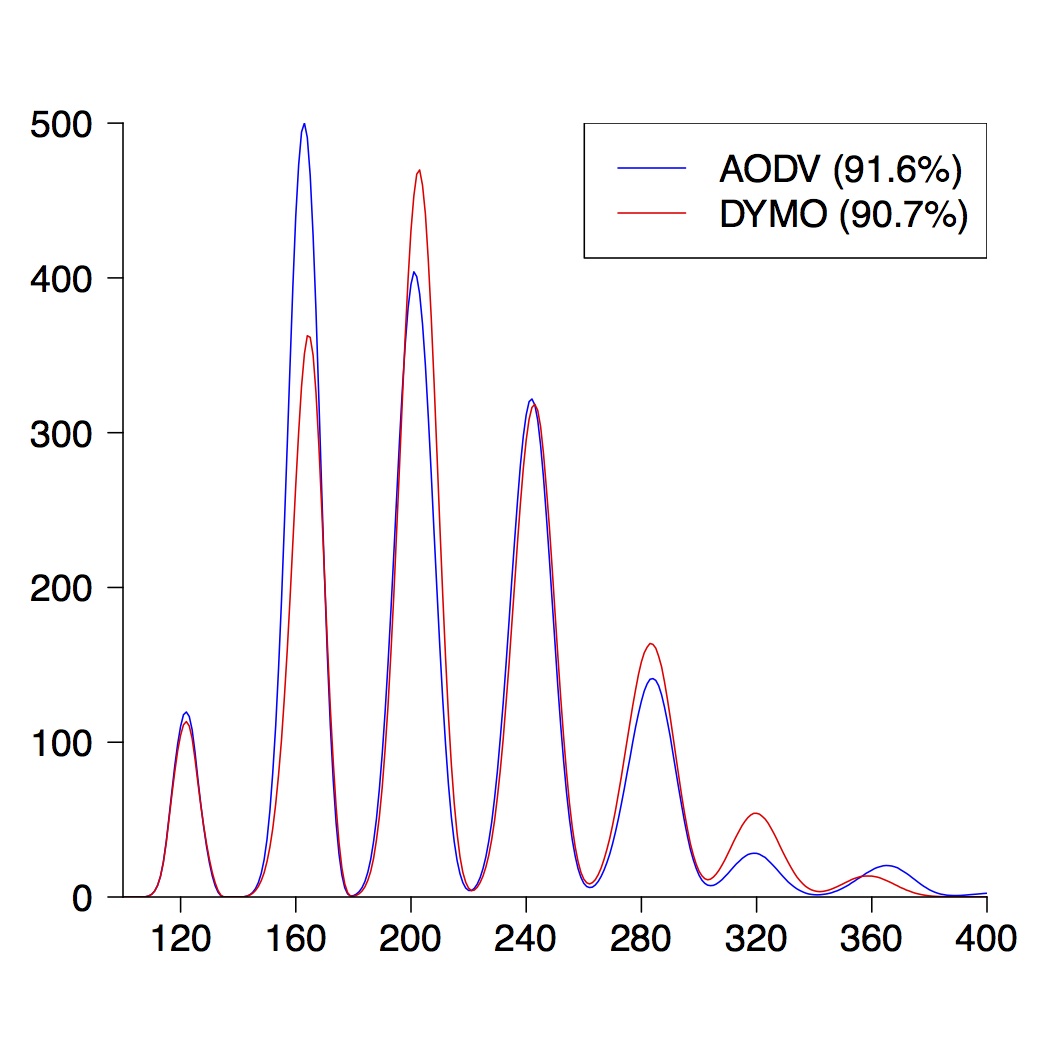
| 4-Node Topologies | ||
|---|---|---|
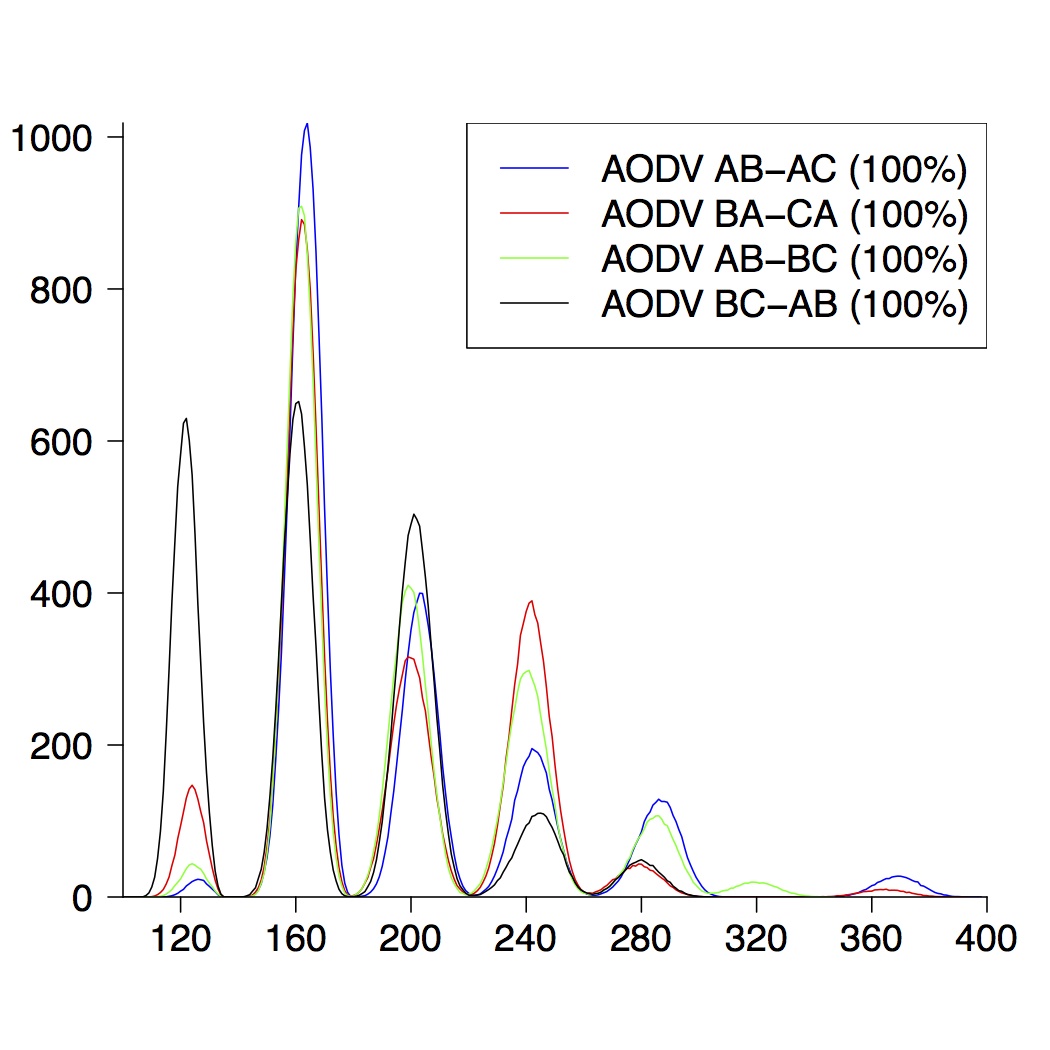 |  |  |
| (a) running time of AODV | (b) route establishment | (c) combined properties |
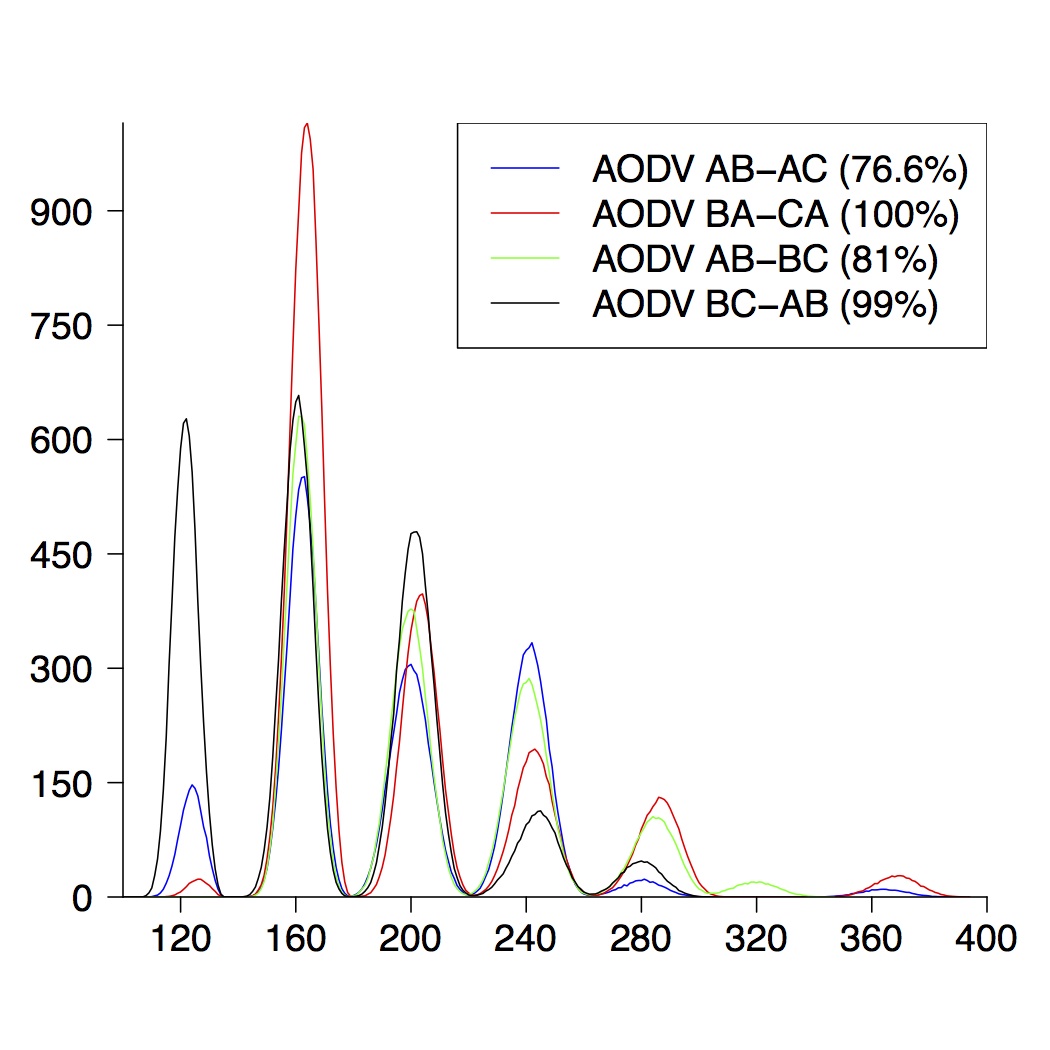
| 5-Node Topologies | ||
|---|---|---|
 |  |  |
| (a) running time of AODV | (b) route establishment | (c) combined properties |
Here we only present the graphical results for network topologies of size 3, 4 and 5. A detailed description can be found in the paper.
| 3-Node Topologies | ||
|---|---|---|
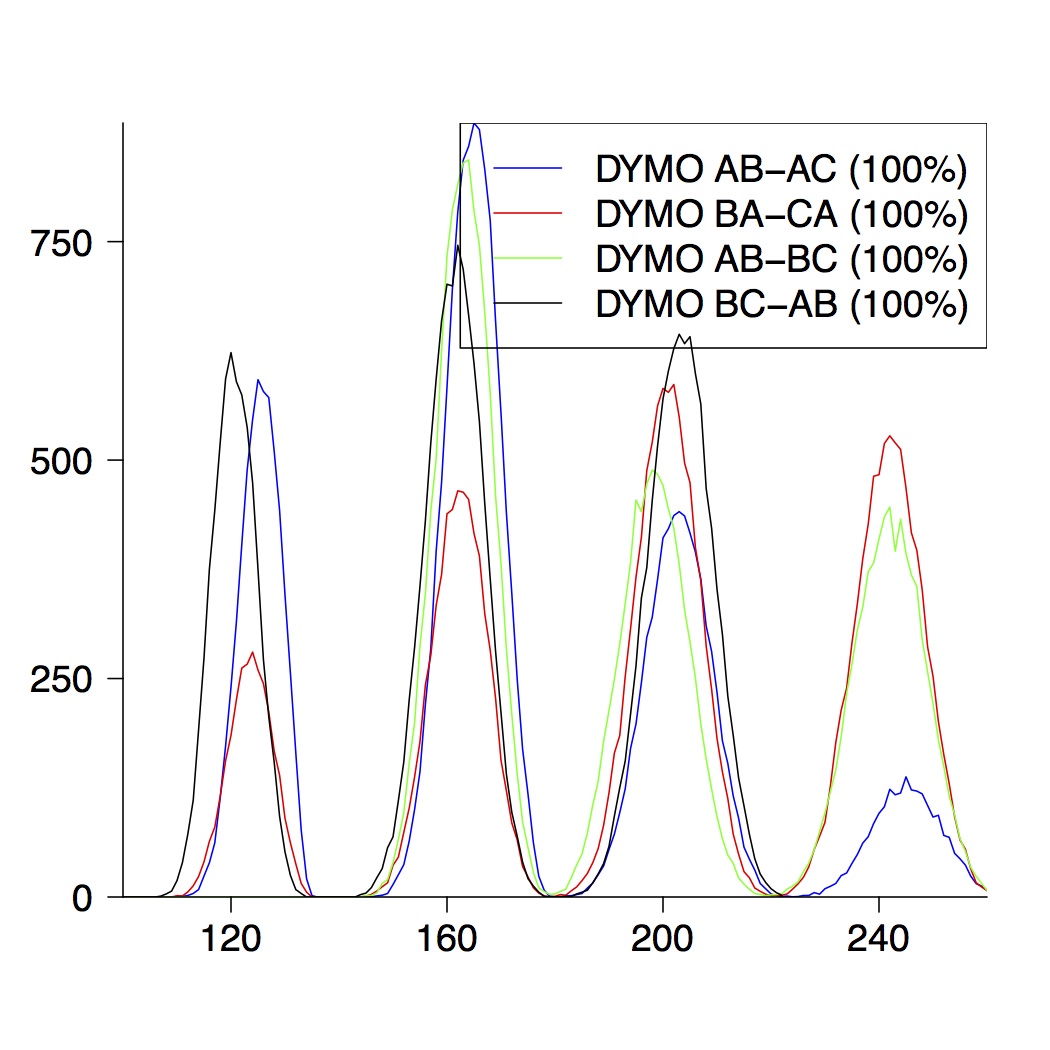 | 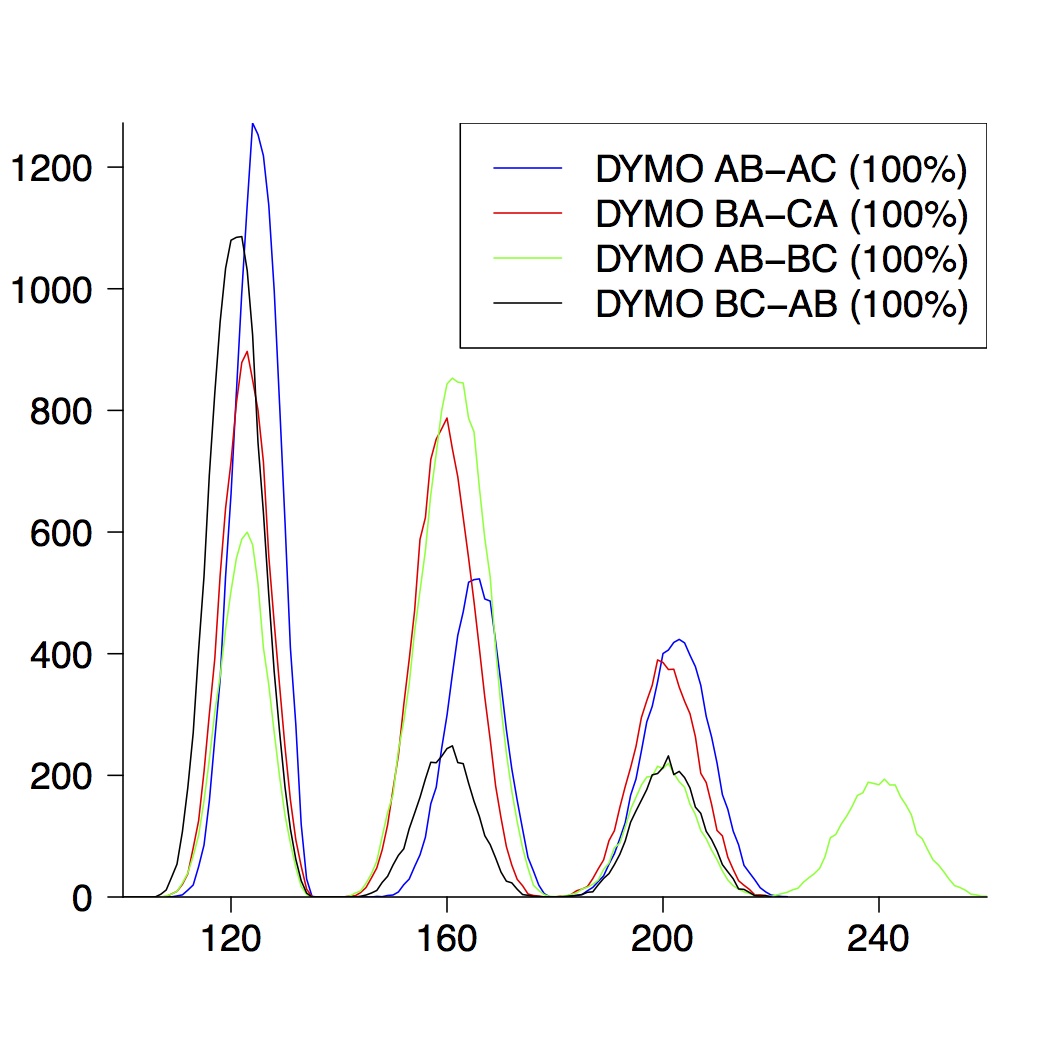 |  |
| (a) running time of DYMO | (b) route establishment | (c) combined properties |
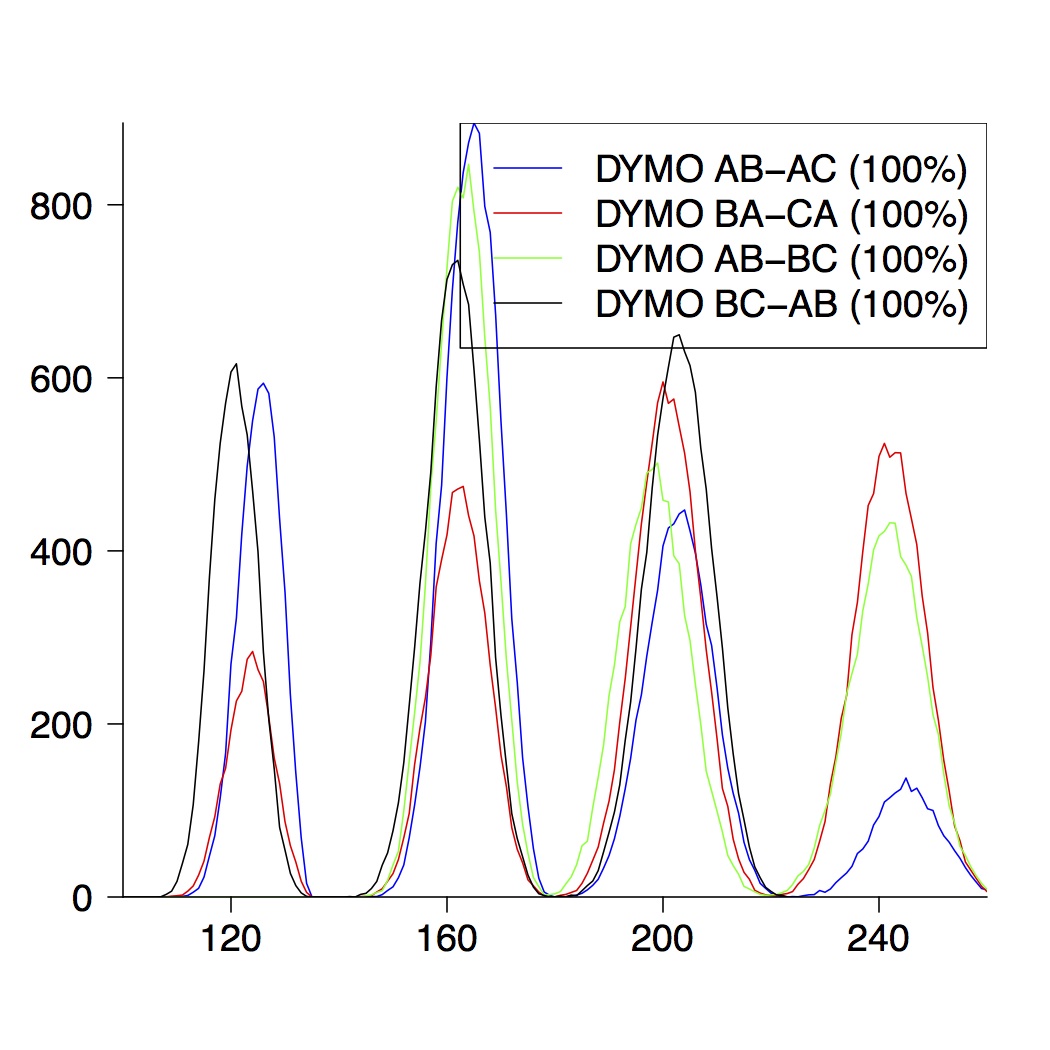
| 4-Node Topologies | ||
|---|---|---|
 |  |  |
| (a) running time of DYMO | (b) route establishment | (c) combined properties |
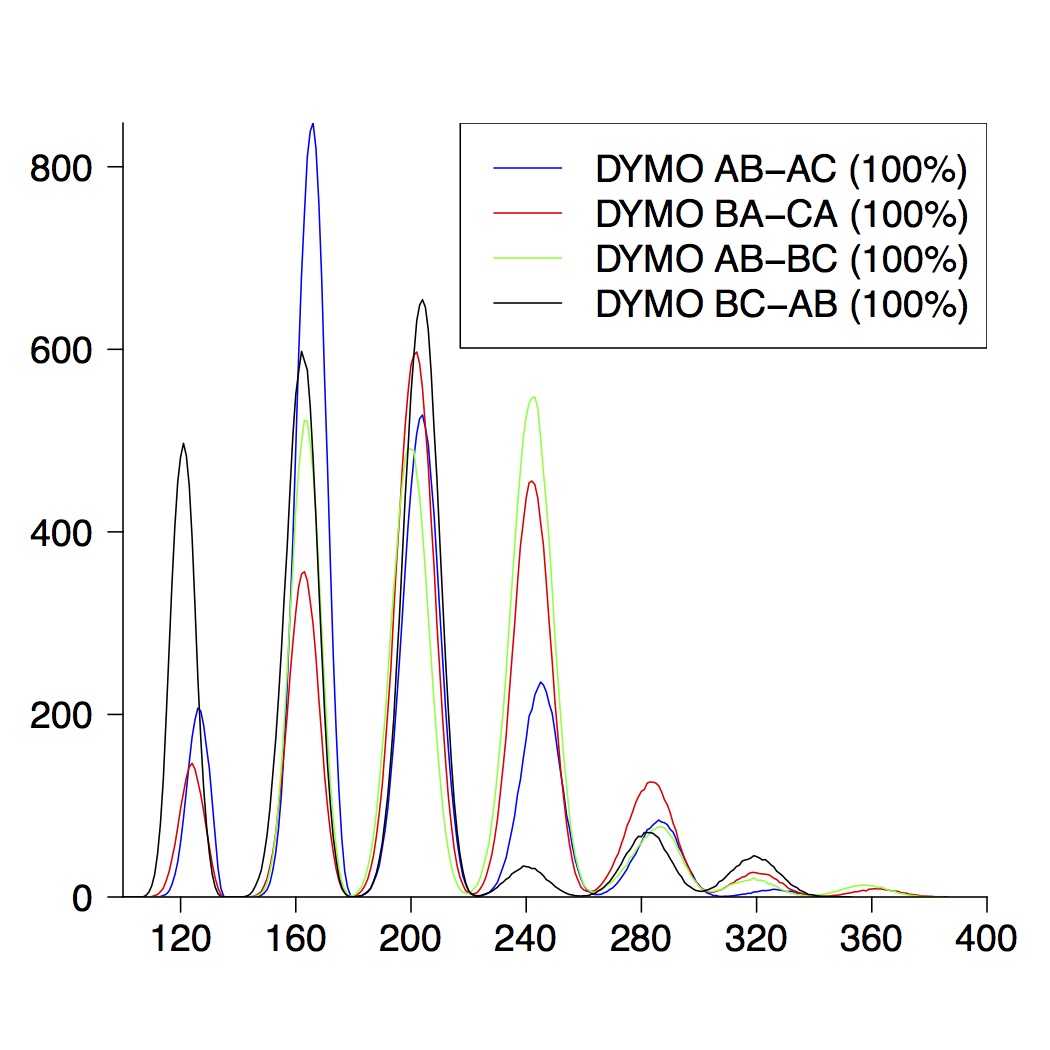
| 5-Node Topologies | ||
|---|---|---|
 |  |  |
| (a) running time of DYMO | (b) route establishment | (c) combined properties |
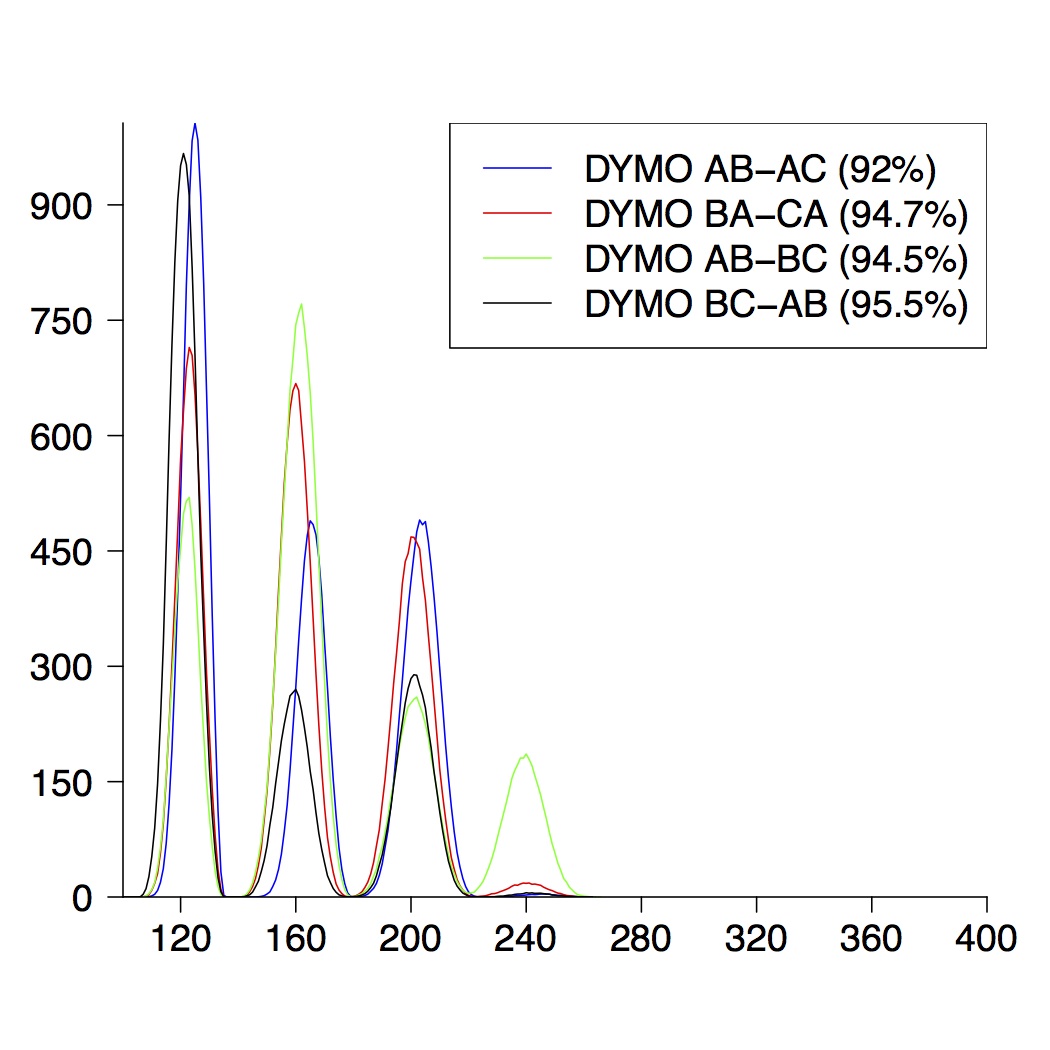
To our surprise, the variation in performance between the two is marginal. A graphical comparison is given in the following graphics.
| 3-Node Topologies | ||
|---|---|---|
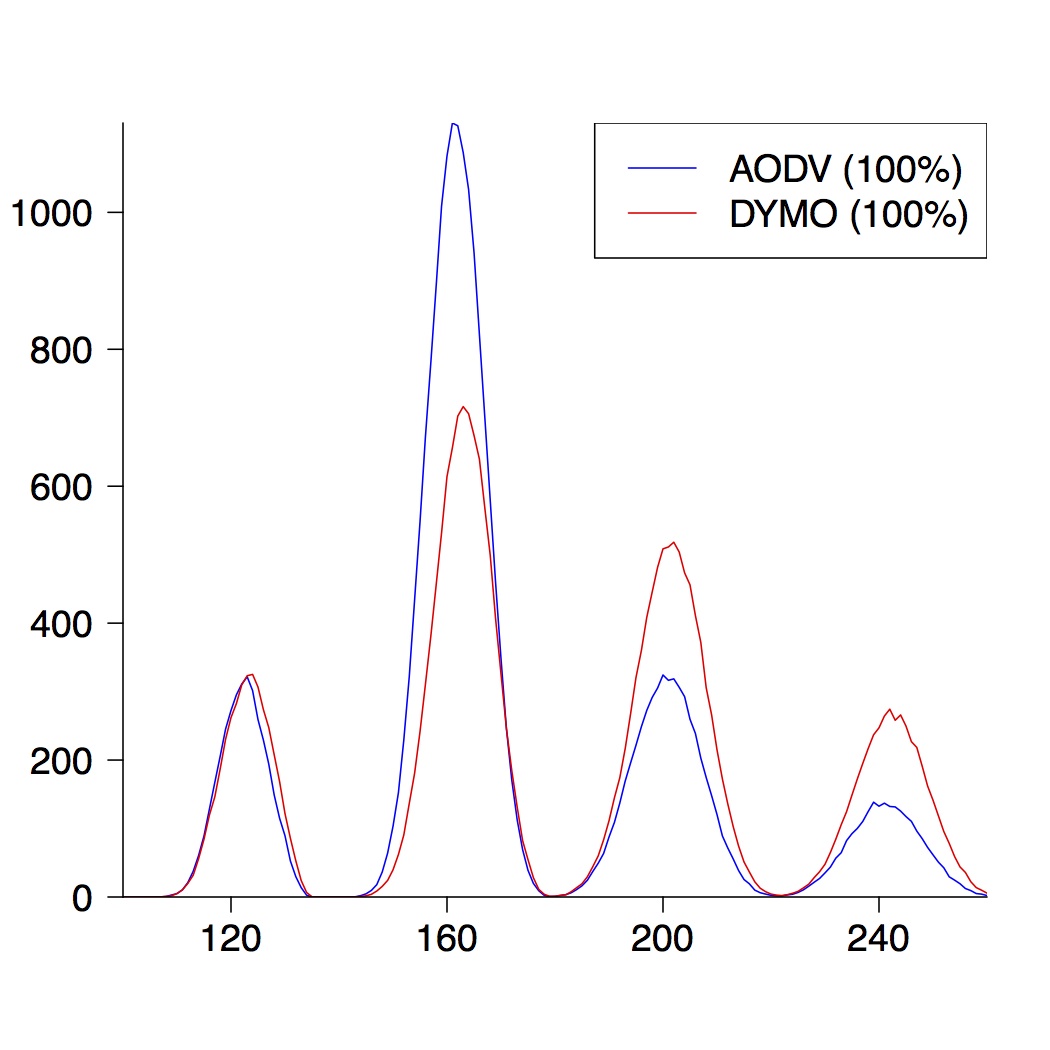 |  |  |
| (a) running time | (b) route establishment | (c) combined properties |
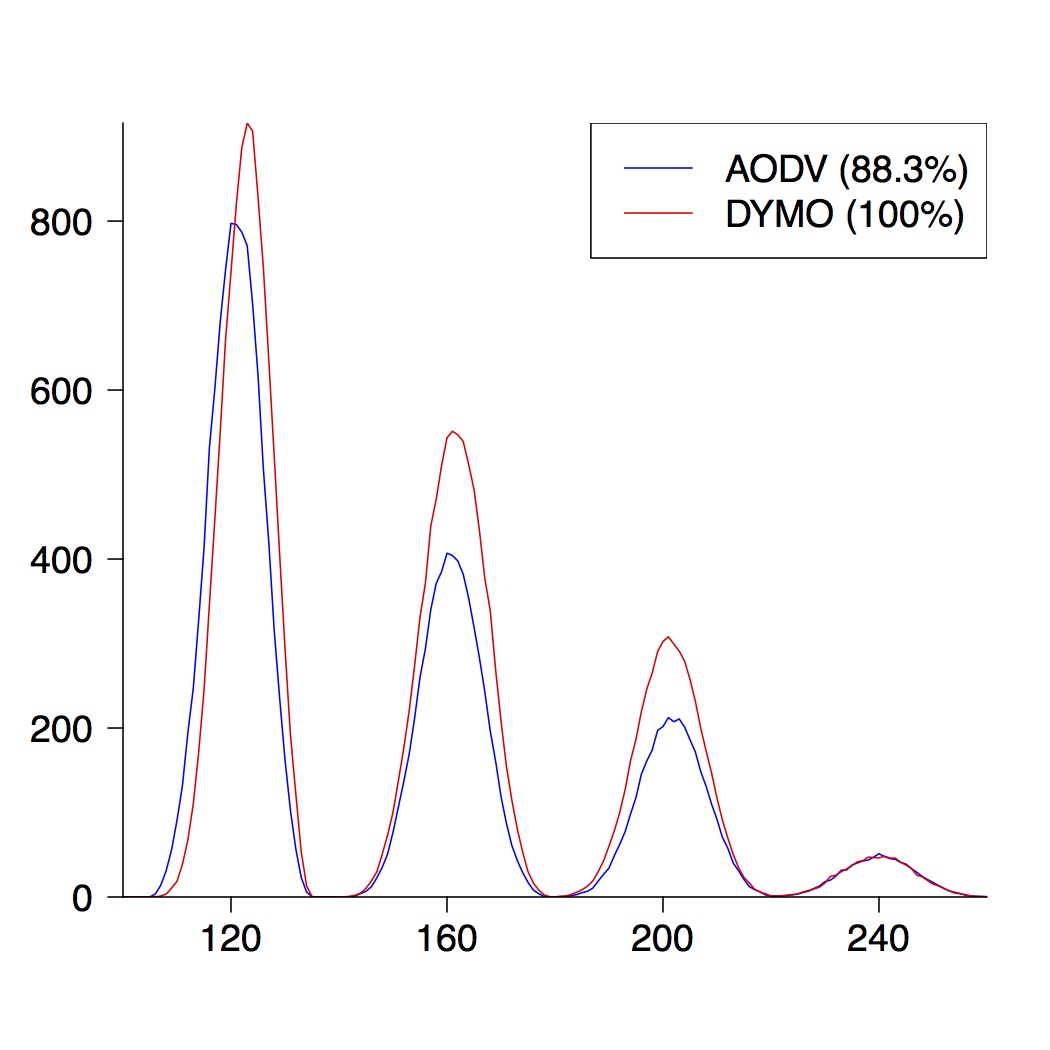
| 4-Node Topologies | ||
|---|---|---|
 |  |  |
| (a) running time | (b) route establishment | (c) combined properties |
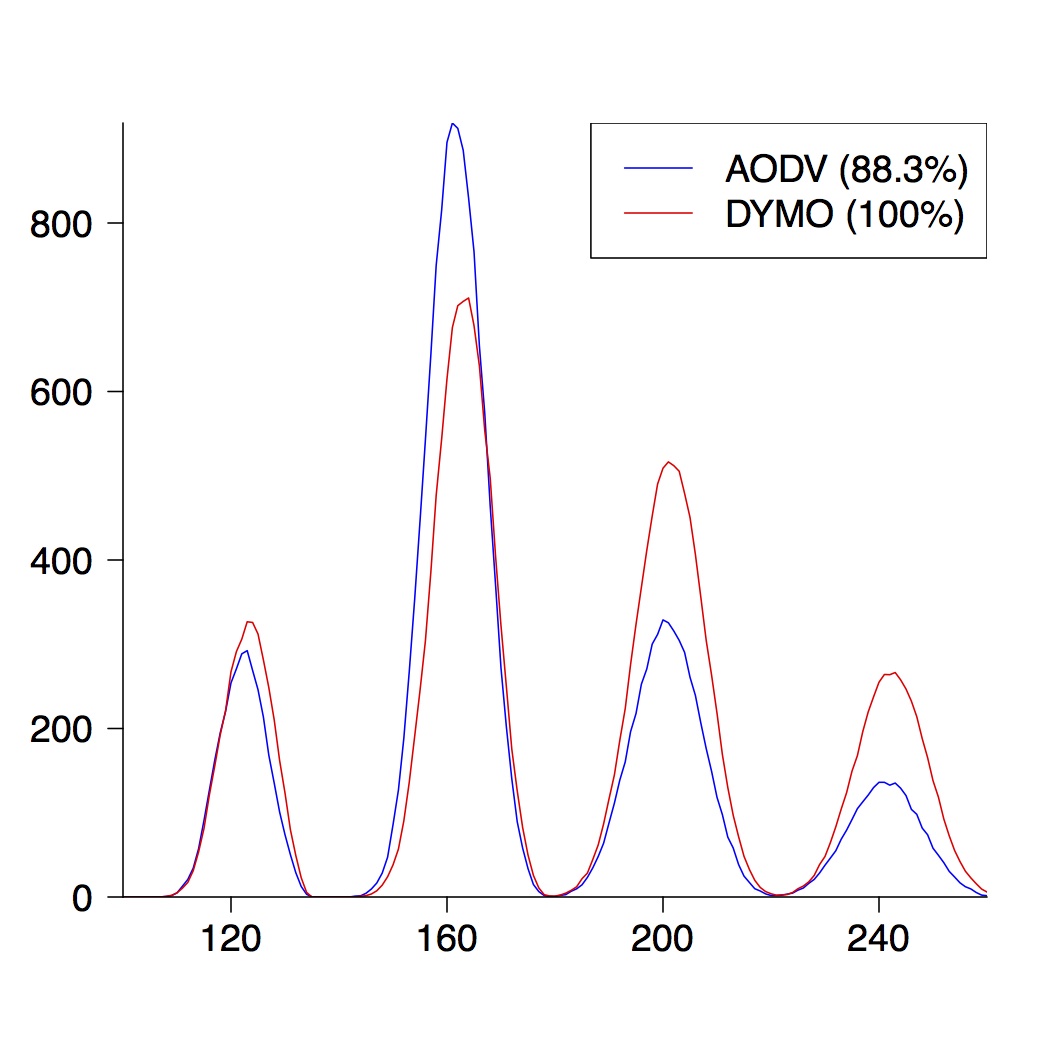
| 5-Node Topologies | ||
|---|---|---|
 |  |  |
| (a) running time | (b) route establishment | (c) combined properties |
The experiments performed showed that in average DYMO establishes fewer routes (compared to AODV). In this section we present an example. It is not an example we generate in the paper, but we tried to find an example that is easy to understand and which does not need too much knowledge about the protocols itself.
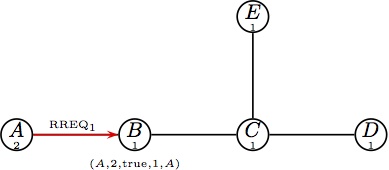
Assume the following topology. (The small numbers in the nodes indicate the nodes' sequence numbers.)
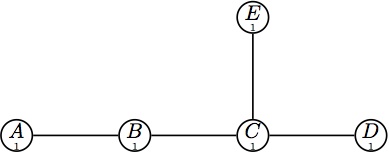 |
| Initial State. |
In our scenario, node A is first looking for a route to C, followed by node B looking for D.
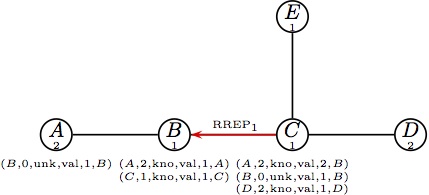
We first show the behaviour of AODV:
| AODV | ||
|---|---|---|
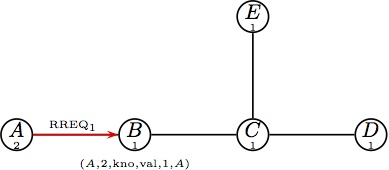 (a) Node A initiates a route RREQ, (a) Node A initiates a route RREQ,which is broadcast to B. | 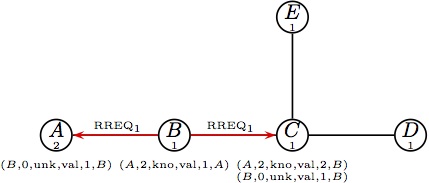 (b) Node B updates its routing table and (b) Node B updates its routing table andforwards the RREQ1. | 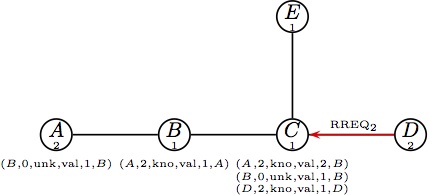 (c) At the same time B is handling RREQ1, (c) At the same time B is handling RREQ1,node D initiates a route request destined for B. |
 (d) Node replies to RREQ1 with a reply, (d) Node replies to RREQ1 with a reply,unicast to B. | 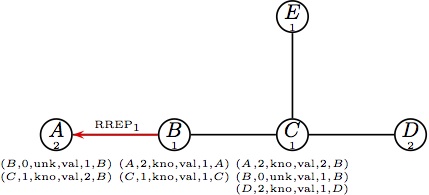 (e) Parts (e) and (f) happen at the same time. (e) Parts (e) and (f) happen at the same time.Node B forwards the reply RREP1. | 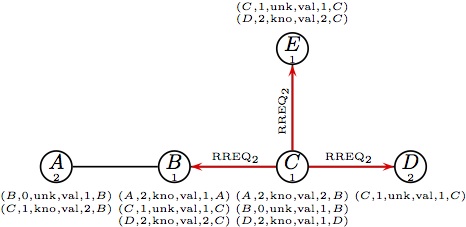 (f) Node C handles RREQ2;it has only a (f) Node C handles RREQ2;it has only aroute with unknown sequence number; it must broadcast it to nodes B, D and E. |
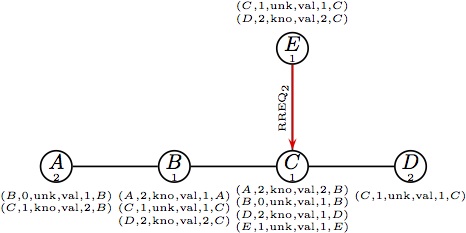 (g) E forwards RREQ2. (g) E forwards RREQ2. | 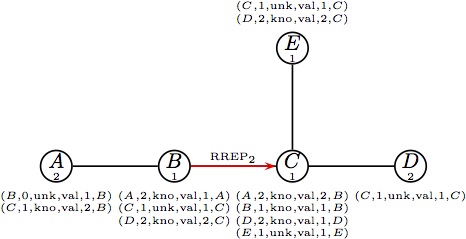 (h) At the same time B generates a reply; (h) At the same time B generates a reply;it forwards RREP2 to C. | 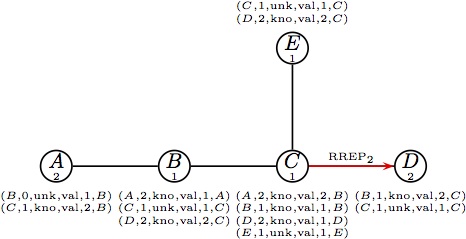 (i) Node C forwards RREP2. (i) Node C forwards RREP2. |
Let us now look at DYMO.
| DYMO | ||
|---|---|---|
 (a) Node A initiates a route RREQ, (a) Node A initiates a route RREQ,which is broadcast to B. | 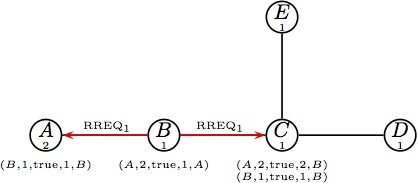 (b) Node B updates its routing table and (b) Node B updates its routing table andforwards the RREQ1. | 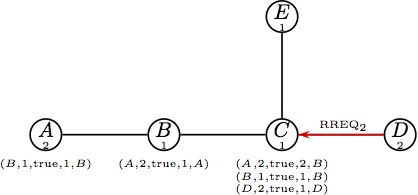 (c) At the same time B is handling RREQ1, (c) At the same time B is handling RREQ1,node D initiates a route request destined for B. |
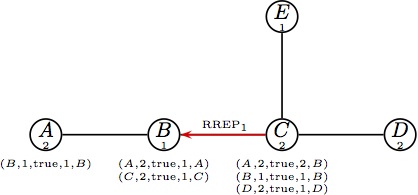 (d) Node replies to RREQ1 with a reply, (d) Node replies to RREQ1 with a reply,increments its SQN and unicasts RREP1. |  (e) Parts (e) and (f) happen at the same time. (e) Parts (e) and (f) happen at the same time.Node B forwards the reply RREP1. | 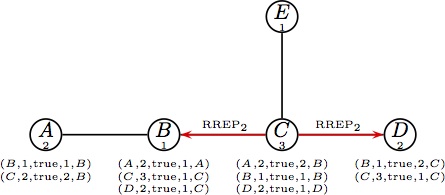 (f) Node C handles RREQ2;thanks to (f) Node C handles RREQ2;thanks toroute accumulation it has a valid route to B; it send replies to B and D. That is the end of the protocol. |
Note that node E is not establishing ANY route and also node C established fewer routes than in the case of AODV.. In total, DYMO established 10 routes, 3 less than AODV.
Contact: Peter Höfner: peter.hoefner <at> nicta.com.au
Last update: 2013